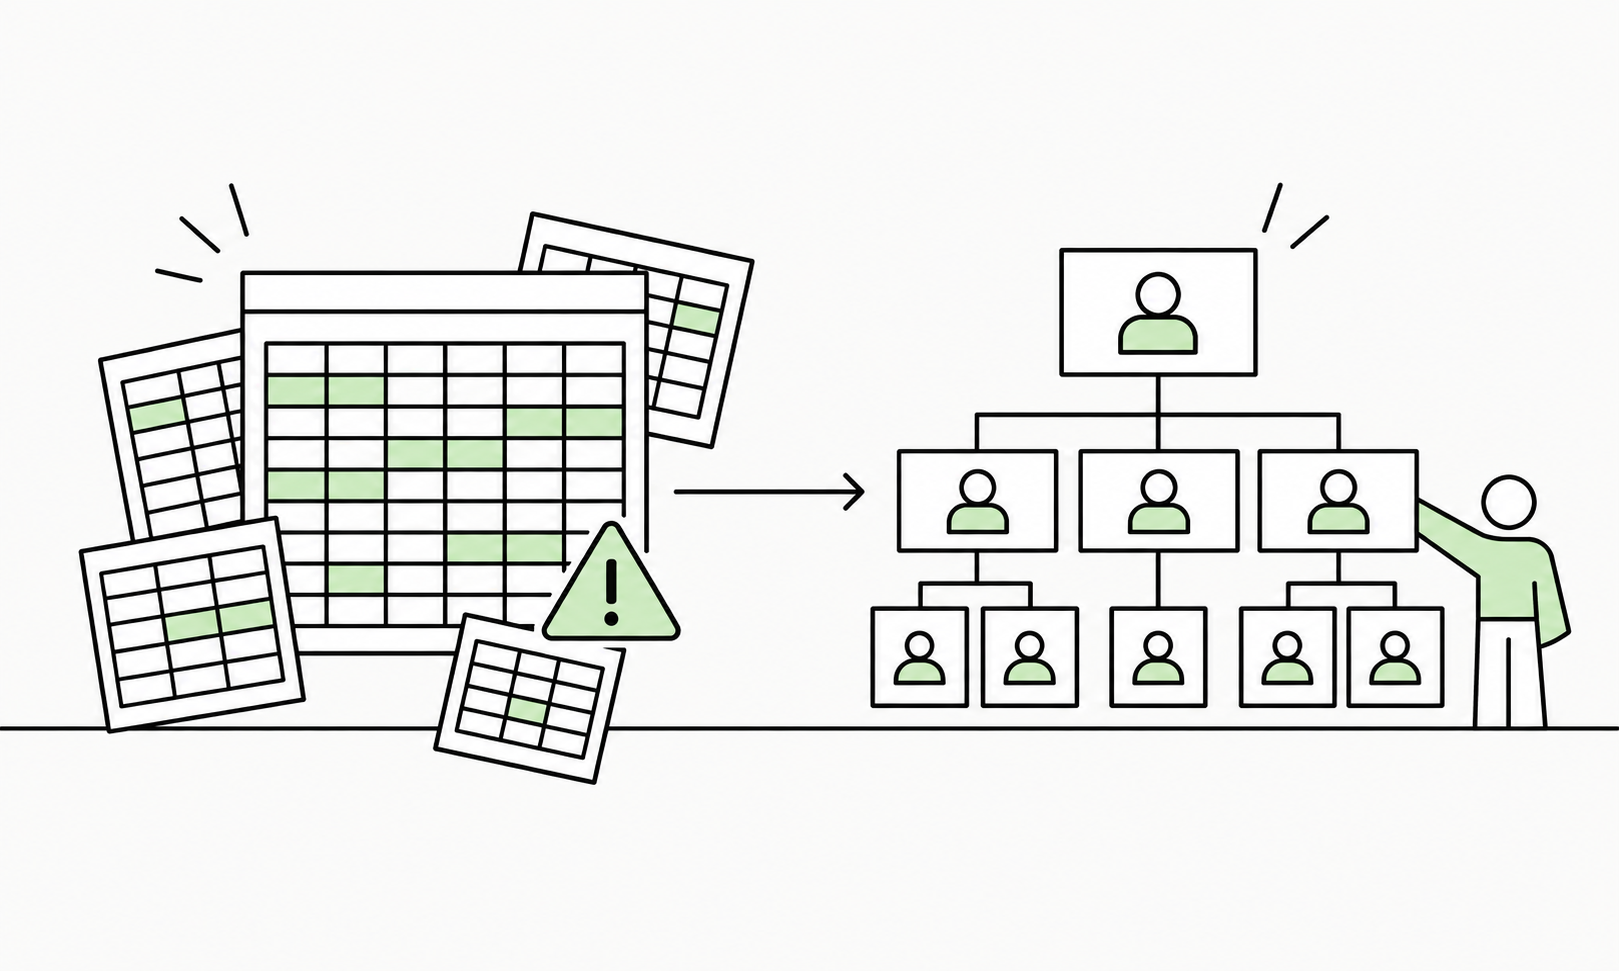
5 Signs Your Company Has Outgrown Its Excel Org Chart
Excel is often a logical place to start when building an organization chart. It is familiar, flexible and may already be where your employee data is maintained.
Small organizations can use Excel to manually manage employee lists, contact information and static org charts. For a simple or relatively stable organizational structure, that may be all you need.
However, as your organization grows, maintaining both your employee data and your org chart can become increasingly challenging.
You may need to manage more detailed employee information, update your organizational structure more frequently, make it easier for colleagues to find and contact the right people, or gain better insight into how your organization is structured.
That does not mean your Excel spreadsheet or org chart is bad. It may simply mean your organization has outgrown the way you are using it.
Here are five signs that may be happening.
Sign 1: Nobody is quite sure which version is current
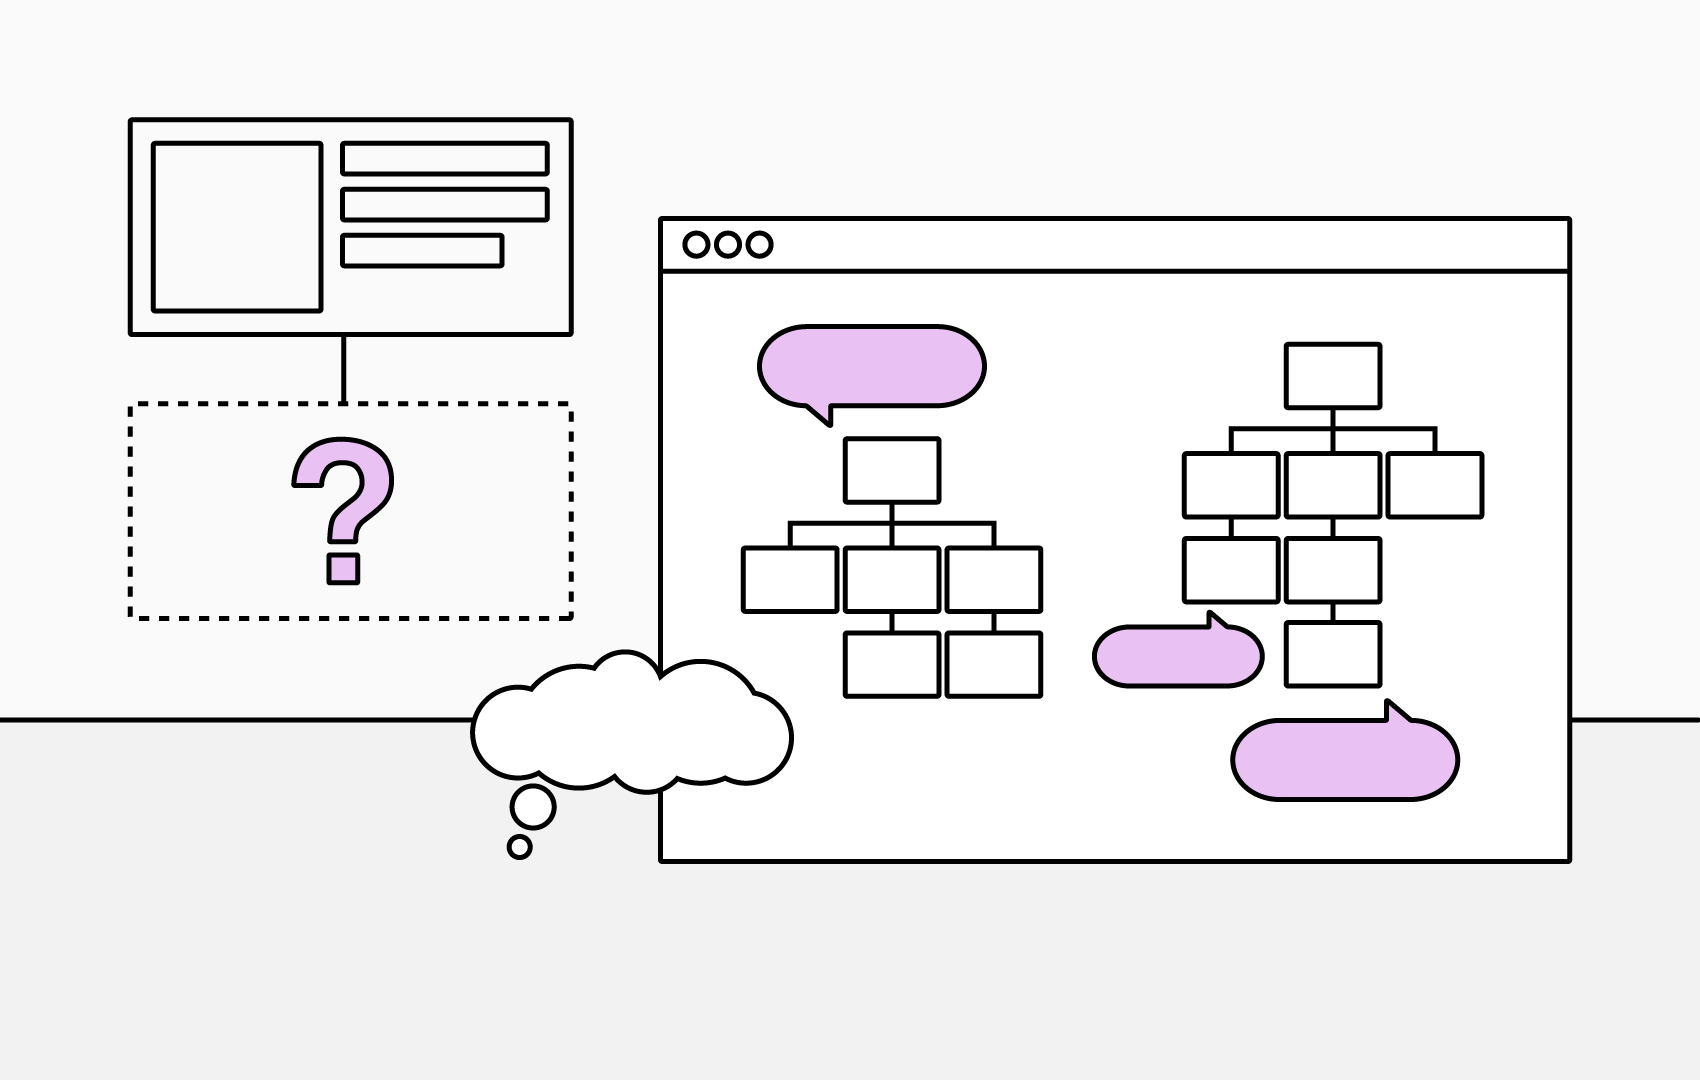
One of the first warning signs is version control. Your organization chart and employee data may have started in a single Excel file, but over time copies can begin to appear in different places.
Copies may have been sent by email, while another version is stored in Teams or SharePoint. Someone may still be using a copy they downloaded several months ago, and different departments may even have created their own versions.
As these copies multiply, it becomes harder for employees to know which version contains the most accurate and up-to-date information.
A useful organization chart should help people find reliable information quickly. If employees first need to work out which file is current, the chart is already creating unnecessary friction and taking up valuable time.
Sign 2: Maintaining the org chart has become someone’s recurring job
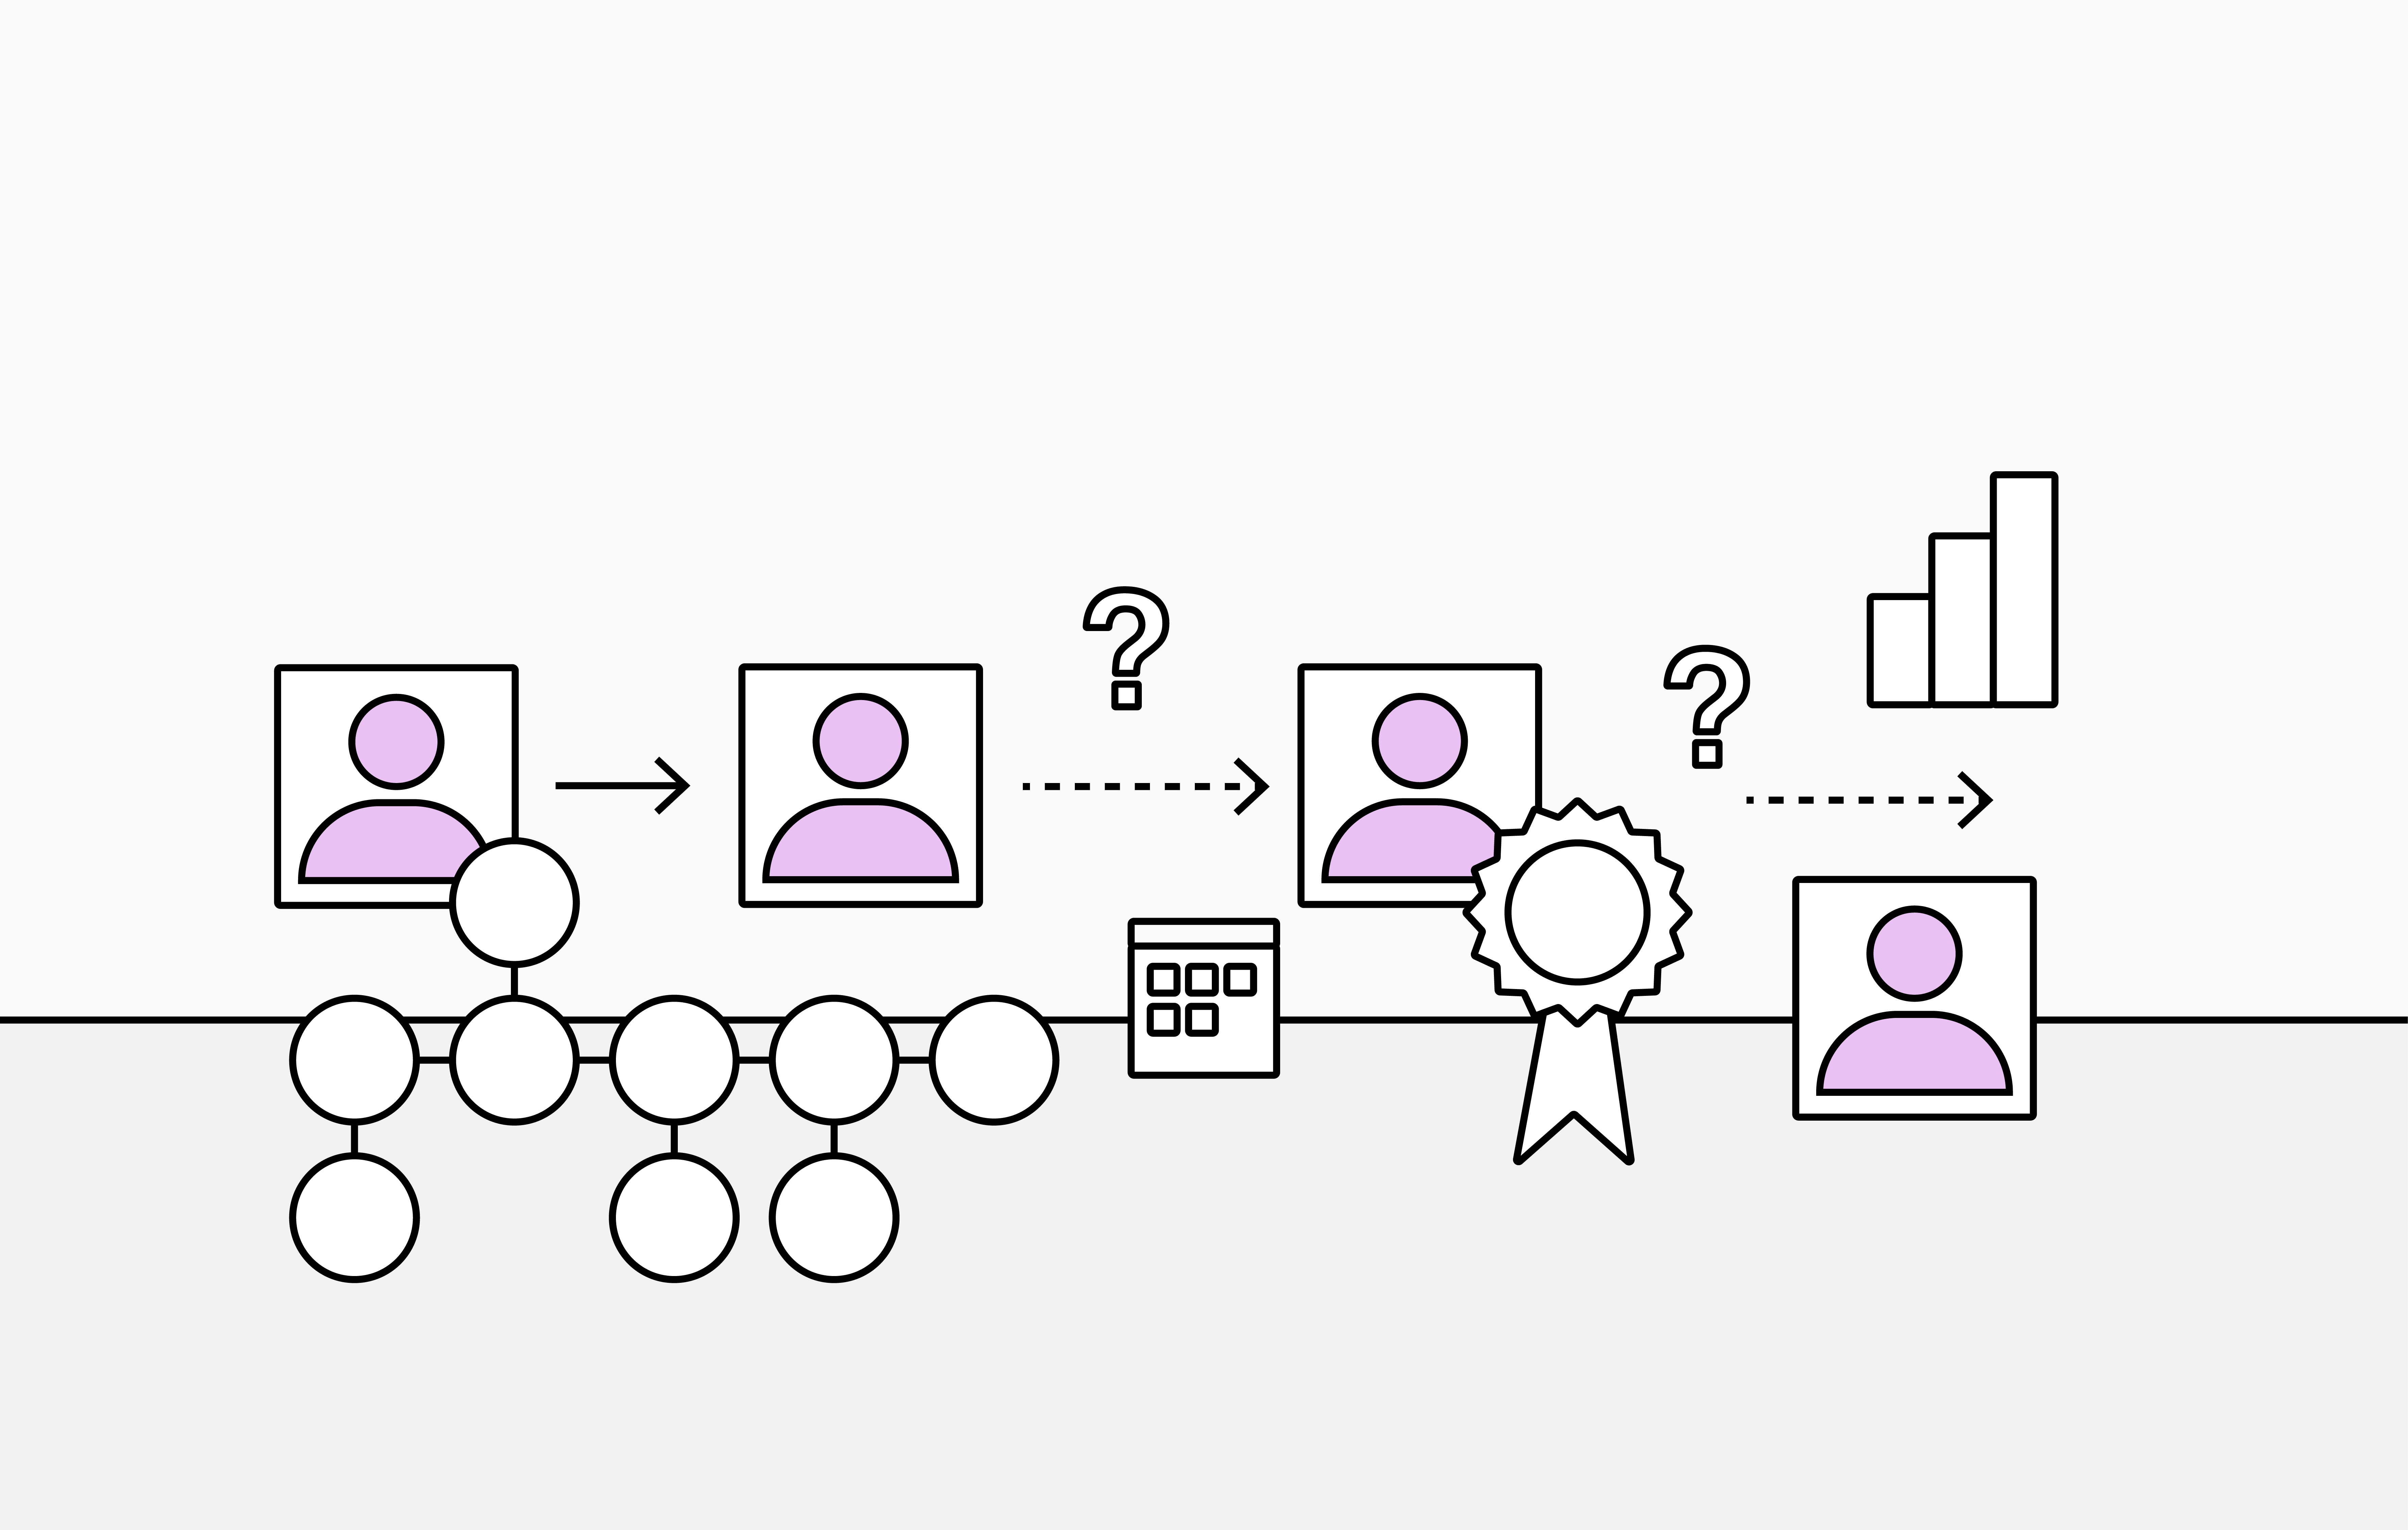
An organization chart is rarely static. Every new starter, leaver, promotion or managerial change potentially requires another update. A departmental restructure might mean dozens of rows need to be edited. Someone then must check the changes, update the spreadsheet and make sure the new version reaches everyone who needs it.
Over time, an org chart can become a recurring administrative chore, when it should instead be a trusted, up-to-date resource that employees can rely on and use regularly.
Sign 3: Your org chart becomes out of date very quickly
Growing organizations change continuously. People join and leave, teams grow and shrink, reporting lines change and departments are reorganized.
A static Excel file can only represent the organization at a particular point in time. That can become a problem when an org chart is only updated periodically. By the time a quarterly chart is distributed, some of the information may already have changed.
Employees may start asking questions such as:
- Is this contact information correct?
- Does this person still report to that manager?
- Has this team moved?
- Is this employee still with the company?
If people have to confirm whether the org chart is accurate before they can rely on it, its usefulness quickly decreases.
Sign 4: Finding the right person or team is becoming difficult
A spreadsheet that works well for 50 employees can become much harder to use when there are 500 or 5,000. Large employee tables can contain hundreds or thousands of rows, sometimes spread across multiple worksheets.
Employees often need easy access to the org chart to answer practical questions such as:
- Who is in this person’s team?
- Who manages this department?
- Where does this team sit within the wider organization?
- Who is responsible for a particular function?
With a static org chart built in Excel, answering these questions can become difficult. Employees may need to search through rows, move between worksheets or manually trace reporting relationships to find the information they need.
New starters can find this particularly challenging because they do not yet understand how different teams and departments fit together.
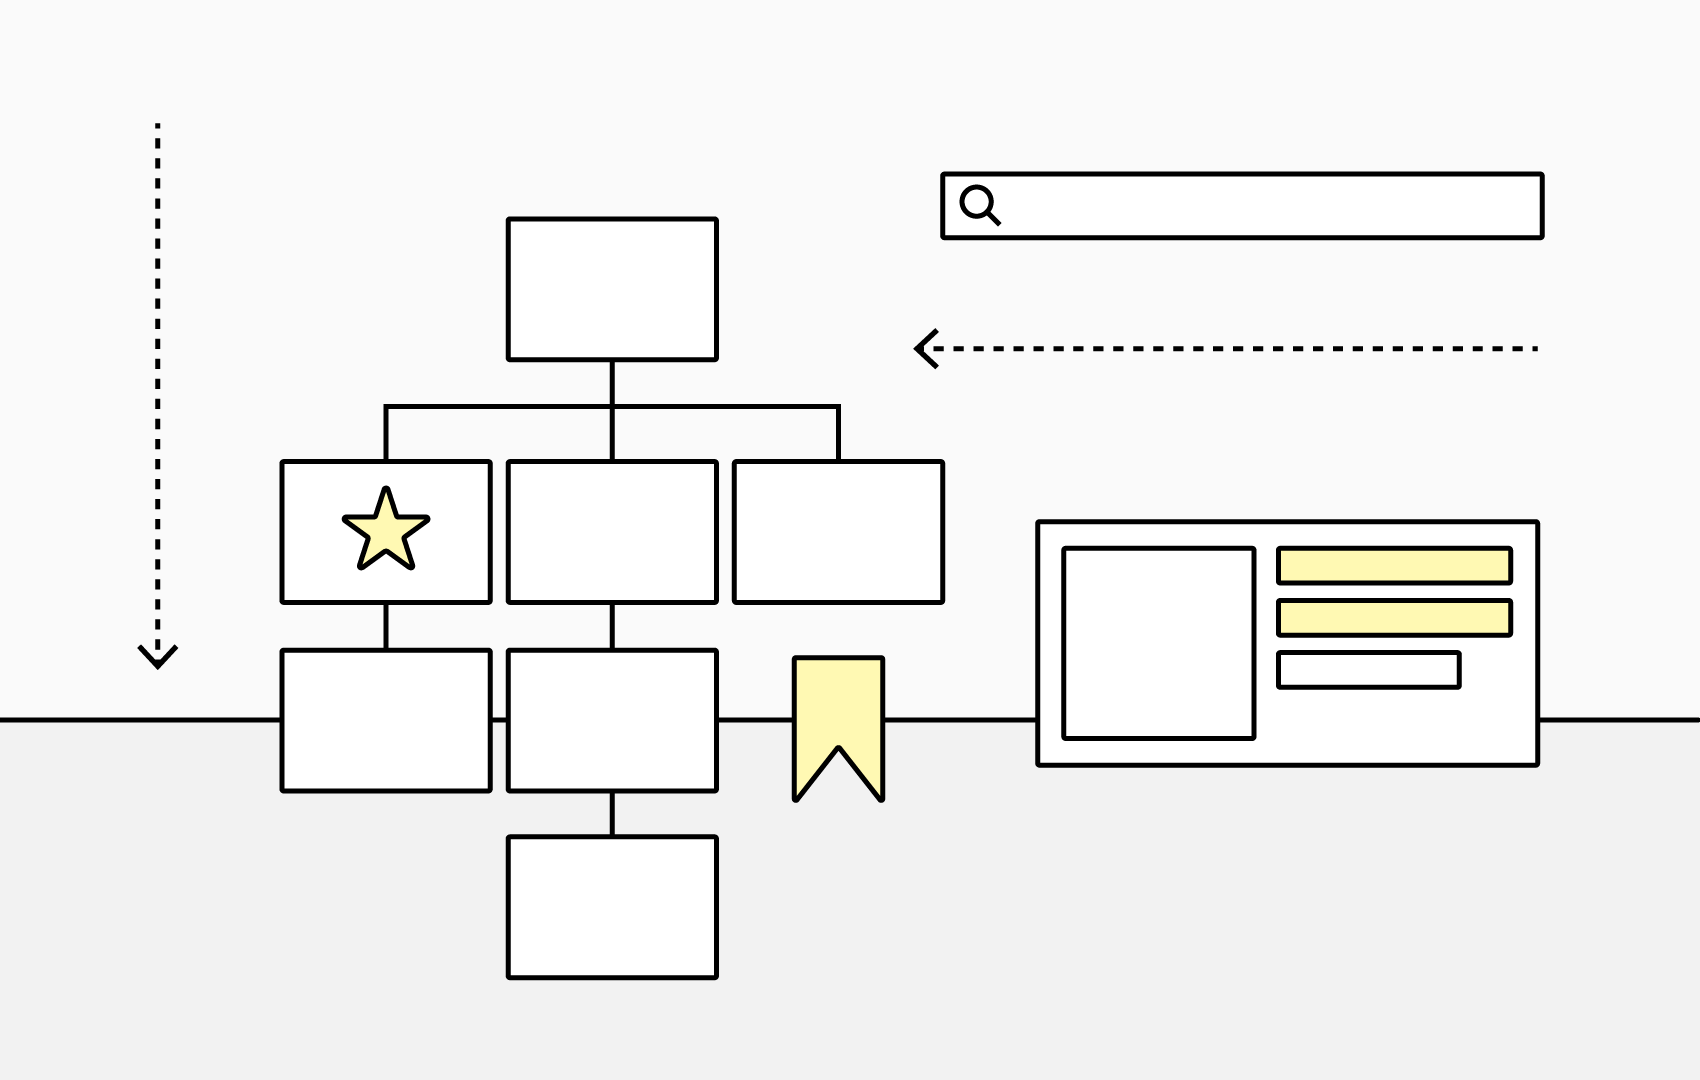
A dynamic organization chart can make the same employee information much easier to explore through features such as:
- Employee search.
- Hierarchy navigation.
- Interactive employee profiles.
- Bookmarks.
- Filters.
- Conditional styling.
Instead of treating the org chart as a document to read, employees can use it as an interactive tool to understand the organization, navigate reporting relationships and find the right people more quickly.
Sign 5: Different audiences need different views of the organization
Not everybody needs to see an organization in the same way. Different teams and individuals may need very different information from an org chart.
- Executives may want a high-level view of the organization together with structural information such as reporting levels or span of control.
- HR teams may need richer employee and organizational information.
- Employees may want a simple, searchable chart where names, roles and contact details are easy to find.
- Department leaders may only need to see the part of the organization they are responsible for.
- New starters may need a straightforward view that helps them understand how their team fits into the wider organization.
Trying to satisfy all of those needs by creating separate spreadsheets introduces another maintenance problem. You may suddenly find yourself maintaining several different versions of the same organizational structure.
Different views should not require different copies of your employee data. A more flexible approach is to maintain the underlying employee information in one place and create different views of that information for different audiences and purposes.
When is Excel still the right choice?
Outgrowing an Excel org chart does not mean Excel has stopped being useful. Excel can still be a very effective tool for organizational work.
It may remain the right choice for:
- Small and relatively stable organizations.
- One-off organizational analysis.
- Preparing employee data.
The important question is not whether Excel is good or bad. It is whether your current approach still meets the needs of your organization.
If Excel remains the right place to maintain your employee data, you may simply need a better way to visualize and navigate that information.
Option 1: Keep working in Excel, but make your org chart dynamic
If your organization is happy maintaining employee data in Excel but manually building and navigating the org chart has become difficult, OrgCharts for Excel provides a natural next step.
OrgCharts for Excel, an Excel add-in, works with the employee information already stored in your workbook.
It can help you:
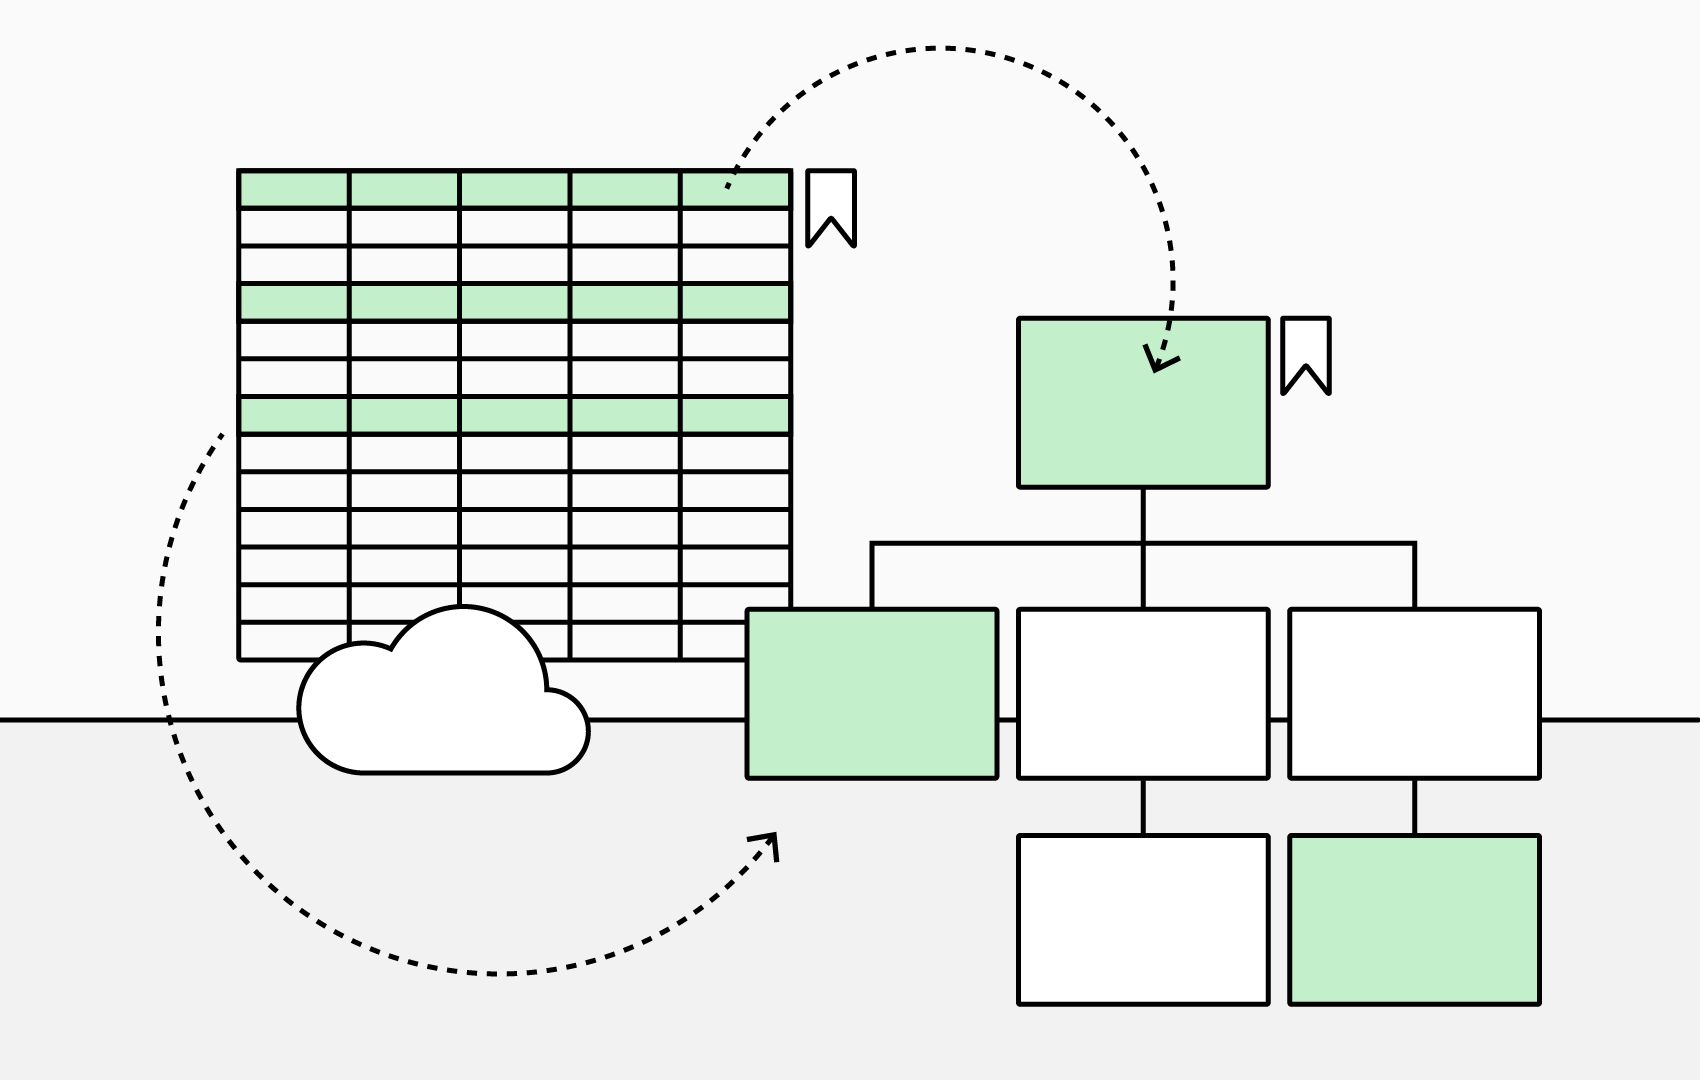
- Transform an existing Excel table into a dynamic, interactive organization chart.
- Continue working inside a familiar environment, using tools you know.
- Automatically reflect changes made to your employee data table in the organization chart.
- Search for people and teams instead of scrolling through large worksheets.
- Filter your Excel table as you move around your org chart.
- Highlight important people and information.
- Navigate reporting relationships directly from the table.
- Export and share your organization chart.
Option 2: Use your existing employee data with a dedicated org chart application
For some organizations, the next step is not to replace Excel or move employee data into a new system. It is to use the employee data they already maintain with a dedicated org chart application.
TeamOrgChart can create organization charts from a range of data sources, including:
- Microsoft Entra ID.
- Excel spreadsheets.
- Excel workbooks stored in OneDrive.
- SharePoint lists.
This means you can continue using the source of employee data that works for your organization while gaining the additional features of a dedicated org chart application.
Depending on the data source you use, TeamOrgChart automatically keeps the chart aligned with changes made to the underlying employee information, helping ensure the organization chart remains useful and up to date.
TeamOrgChart can then make that employee data much easier to explore and understand through features such as:
- Employee search.
- Interactive hierarchy navigation.
- Employee profiles.
- Bookmarks.
- Filters.
- Conditional formatting and highlighting.
- Multiple organization charts for different audiences and purposes.
- Different starting points within the organization.
- Different views of the same underlying employee data.
- Access through Microsoft Teams and SharePoint.
A dedicated org chart application can also provide insight that is difficult to gain from a static spreadsheet.
For example, TeamOrgChart can help you explore reporting relationships, understand how teams fit together and review organizational structure more visually.
Its Data Health tools can also help identify issues within the data used to build the chart, including:
- Missing employee information.
- Duplicate identifiers.
- Missing managers.
- Circular reporting relationships.
The important difference is that your existing employee data becomes the foundation for a more interactive and useful organization chart.
Rather than simply viewing rows in a spreadsheet or a static chart, employees can search, navigate and interact with the organization, while administrators have more tools for managing how that information is presented.
In conclusion
The right org chart should make organizational information easier to maintain, understand and use. Whether that means enhancing the Excel data you already work with or connecting it to a dedicated org chart application, the goal is the same: give employees a trusted, up-to-date view of the organization that they can use every day.
As your organization grows and changes, your org chart should be able to grow with it rather than becoming another static document to maintain.