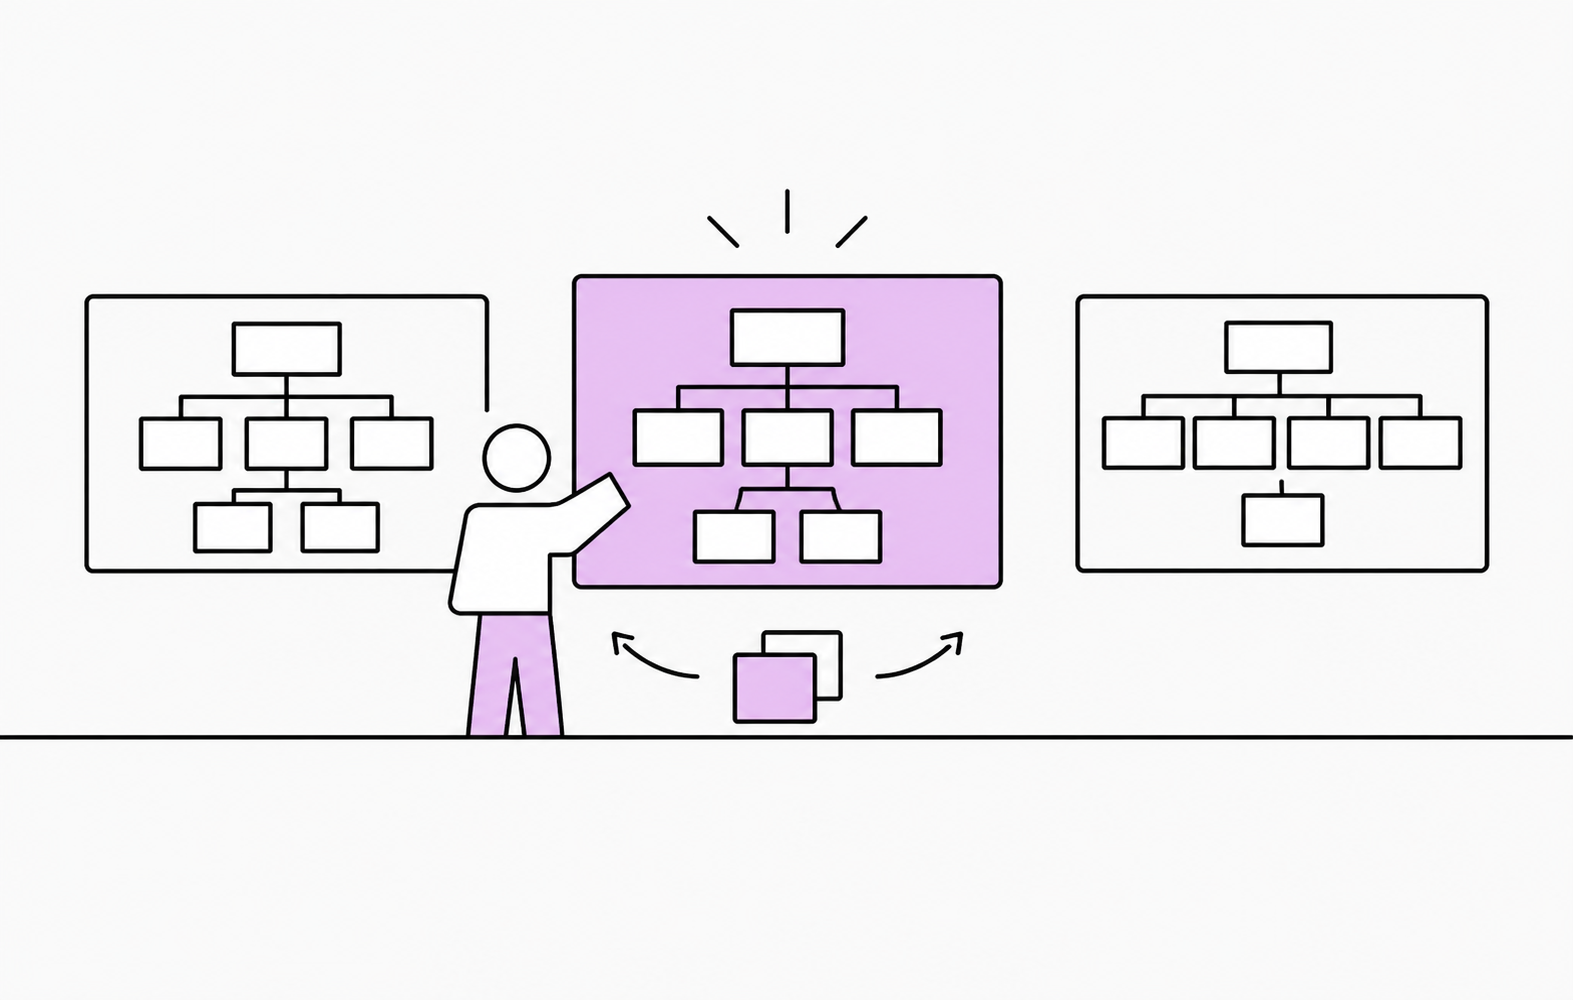
Managing and Creating Multiple Org Charts in TeamOrgChart
Organizations often need more than one org chart. A single company-wide chart may be useful for giving employees an overview of the whole business, but different teams and audiences may need different levels of detail or different starting points.
TeamOrgChart lets you create multiple organization charts rather than forcing every use case into a single view. There is no fixed limit on the number of charts you can create, so you can build separate charts for different teams, audiences and purposes.
Why would you need more than one org chart?
Different charts can serve different purposes across the organization.
For example, you may want:
- A company-wide organization chart.
- Individual department charts.
- Leadership and management views.
- Onboarding-specific charts.
- Separate charts for different audiences or business units.
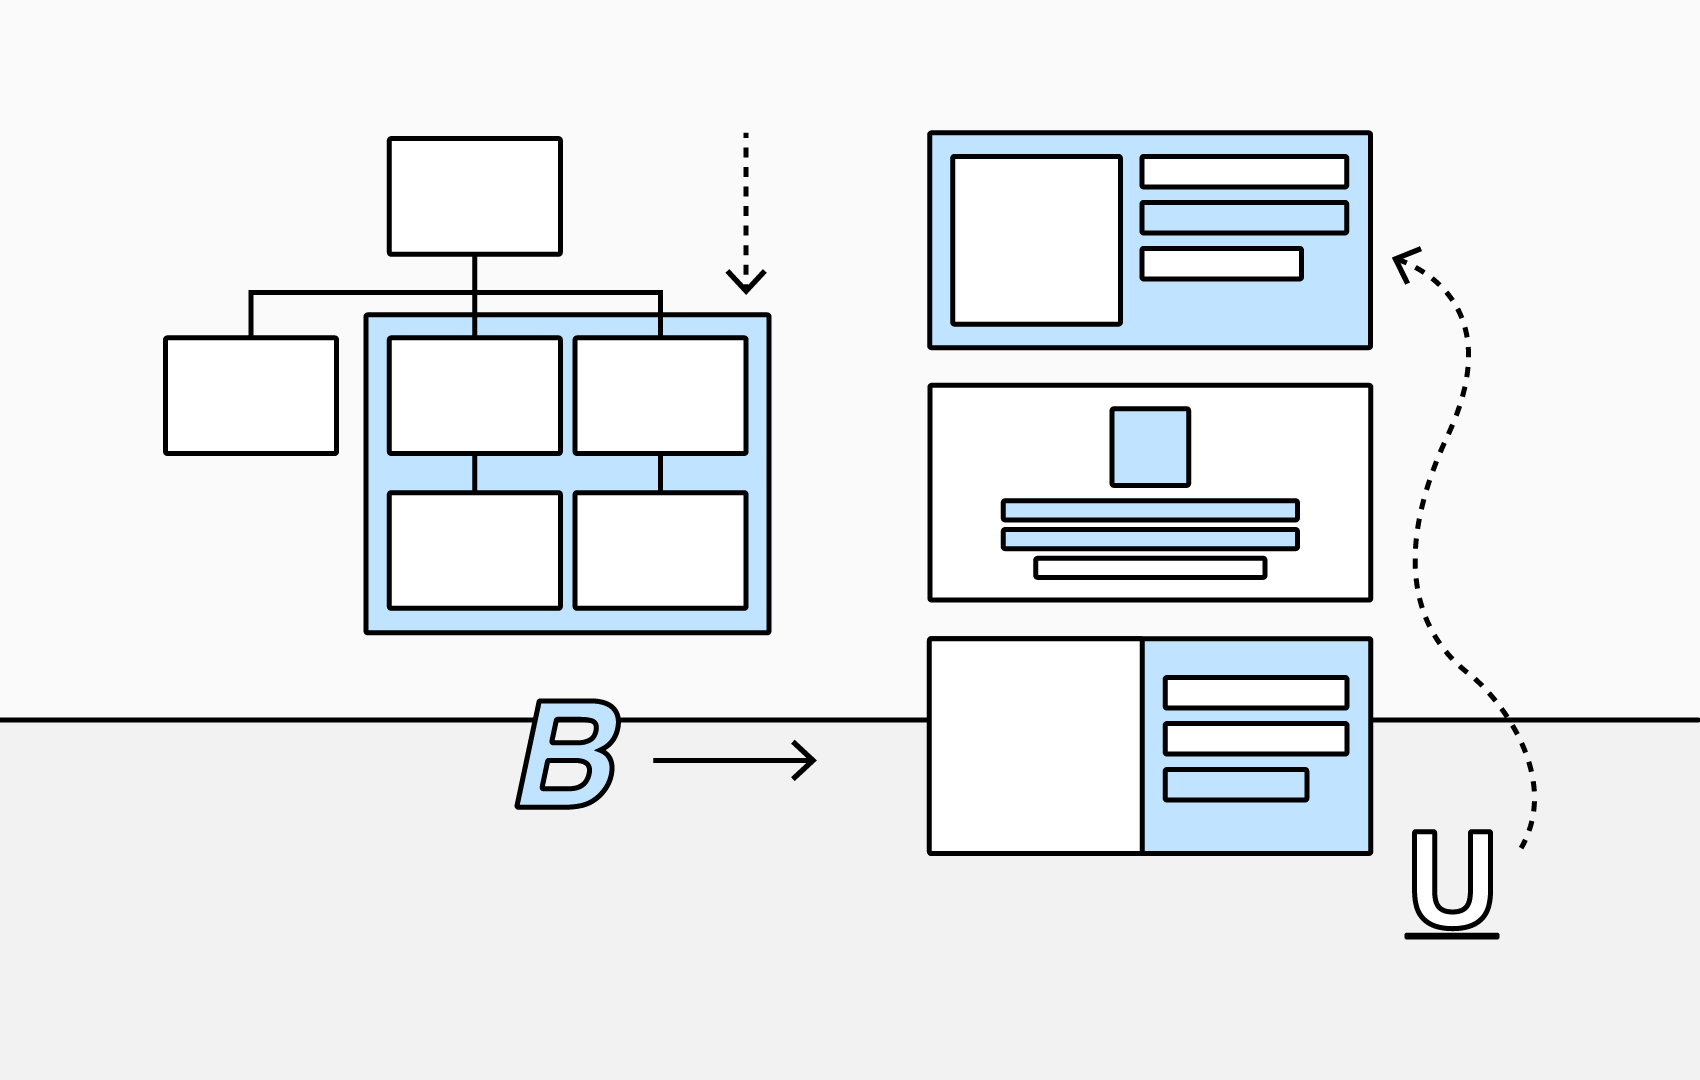
Each chart can be configured independently, allowing you to choose a different starting point, styling, filters, rules or level of detail depending on how the chart will be used.
This means an executive view can be kept simple and high level, while a departmental or onboarding chart can show more detail without changing the underlying employee data.
Use meaningful chart names
As your chart library grows, it becomes increasingly important to be able to quickly understand the purpose of each chart.
Use clear and descriptive chart names that explain the audience, region or purpose of the chart.
For example:
- Company Org Chart.
- UK Organization.
- Sales Team.
- Executive Team.
- New Starter Organization Guide.
Good chart names make it easier for administrators and users to find the right chart without having to open several different views first.
Switching between charts
TeamOrgChart provides different ways to move between and manage your organization charts.
Chart Selector
The Chart Selector is available from the chart toolbar while you are viewing a chart. It lets you quickly review your available charts and open a different one.
From the Chart Selector, you can:
- View your available charts in one place.
- Open another chart.
- See the data source used by each chart.
- Check the visibility status of each chart.
- Create a new chart.
This is useful when you are already working in a chart and want to move quickly to another organizational view.
Dashboard
The dashboard provides a broader overview of the charts available to you.
It can be used to review your chart library, open individual charts and manage them from one central location.
As the number of charts grows, the dashboard becomes particularly useful for keeping different organizational charts organized and easy to access.
Duplicate an existing chart
Sometimes you need a new chart that is very similar to one you already have.
Rather than starting again, TeamOrgChart lets chart administrators duplicate an existing chart. This is useful when you want to experiment with a different configuration, create another version for a different audience or capture a snapshot of a chart at a particular point in time.
When duplicating a chart, you can choose whether to include items such as vacant positions, temporary positions and additional roles. If the original chart uses a connected data source such as Microsoft Entra ID, you can also choose whether the duplicate should retain that connection or be created as an Excel-based chart.
You can then adjust the duplicated chart to suit its new purpose, for example by changing:
- Conditional rules.
- Filters.
- Chart styling.
- Starting position.
- Visible employee information.
- Vacant or temporary positions.
Duplicating a chart can save significant setup time when multiple charts need to follow a similar structure or design.
Control chart visibility
Not every chart needs to be available to every user.
TeamOrgChart provides three visibility states that control who can view and work with a chart.
Published
A published chart can be viewed and edited by chart administrators, while read-only users can also view it.
This is normally appropriate for charts that are ready to be used more widely across the organization.
Unpublished
An unpublished chart can be viewed and edited by chart administrators, but read-only users cannot see it. New charts are unpublished by default.
This is useful while a chart is still being configured or reviewed before wider publication.
Private
A private chart can only be viewed and edited by the person who created it.
This can be useful when experimenting with a new chart, planning a potential structure or creating a view that is not intended to be shared yet.
Chart visibility can be changed from the chart toolbar or from the chart list on the dashboard.
Use multiple charts without making management complicated
Creating multiple charts does not mean every chart has to be maintained completely independently.
TeamOrgChart allows you to create different organizational views for different audiences while still using the same underlying employee data where appropriate.
This makes it possible to give executives, departments, new starters and other groups the view that is most useful to them, without forcing everyone to work from the same organization chart.
As your organization grows, using multiple clearly named and well-managed charts can make organizational information easier to navigate, easier to share and more relevant to the people using it.