5 Features to Try During Your TeamOrgChart Free Trial
1. Conditional Rules
Conditional rules are one of the most important ways to make your org chart reflect the unique practices of your organization. With logic-based rules, you can define how your chart functions, from styling and visibility to interactivity. These rules are automatically applied, so when a new person joins, you don’t need to make manual adjustments.
For example, you could set a rule so that if an employee’s department contains “HR,” their chart box automatically turns yellow. Or, if accountEnabled is set to false, the person can be excluded from the chart entirely. This level of automation ensures that your chart is always up to date and aligned with your internal processes.
2. Customize Your Chart Boxes
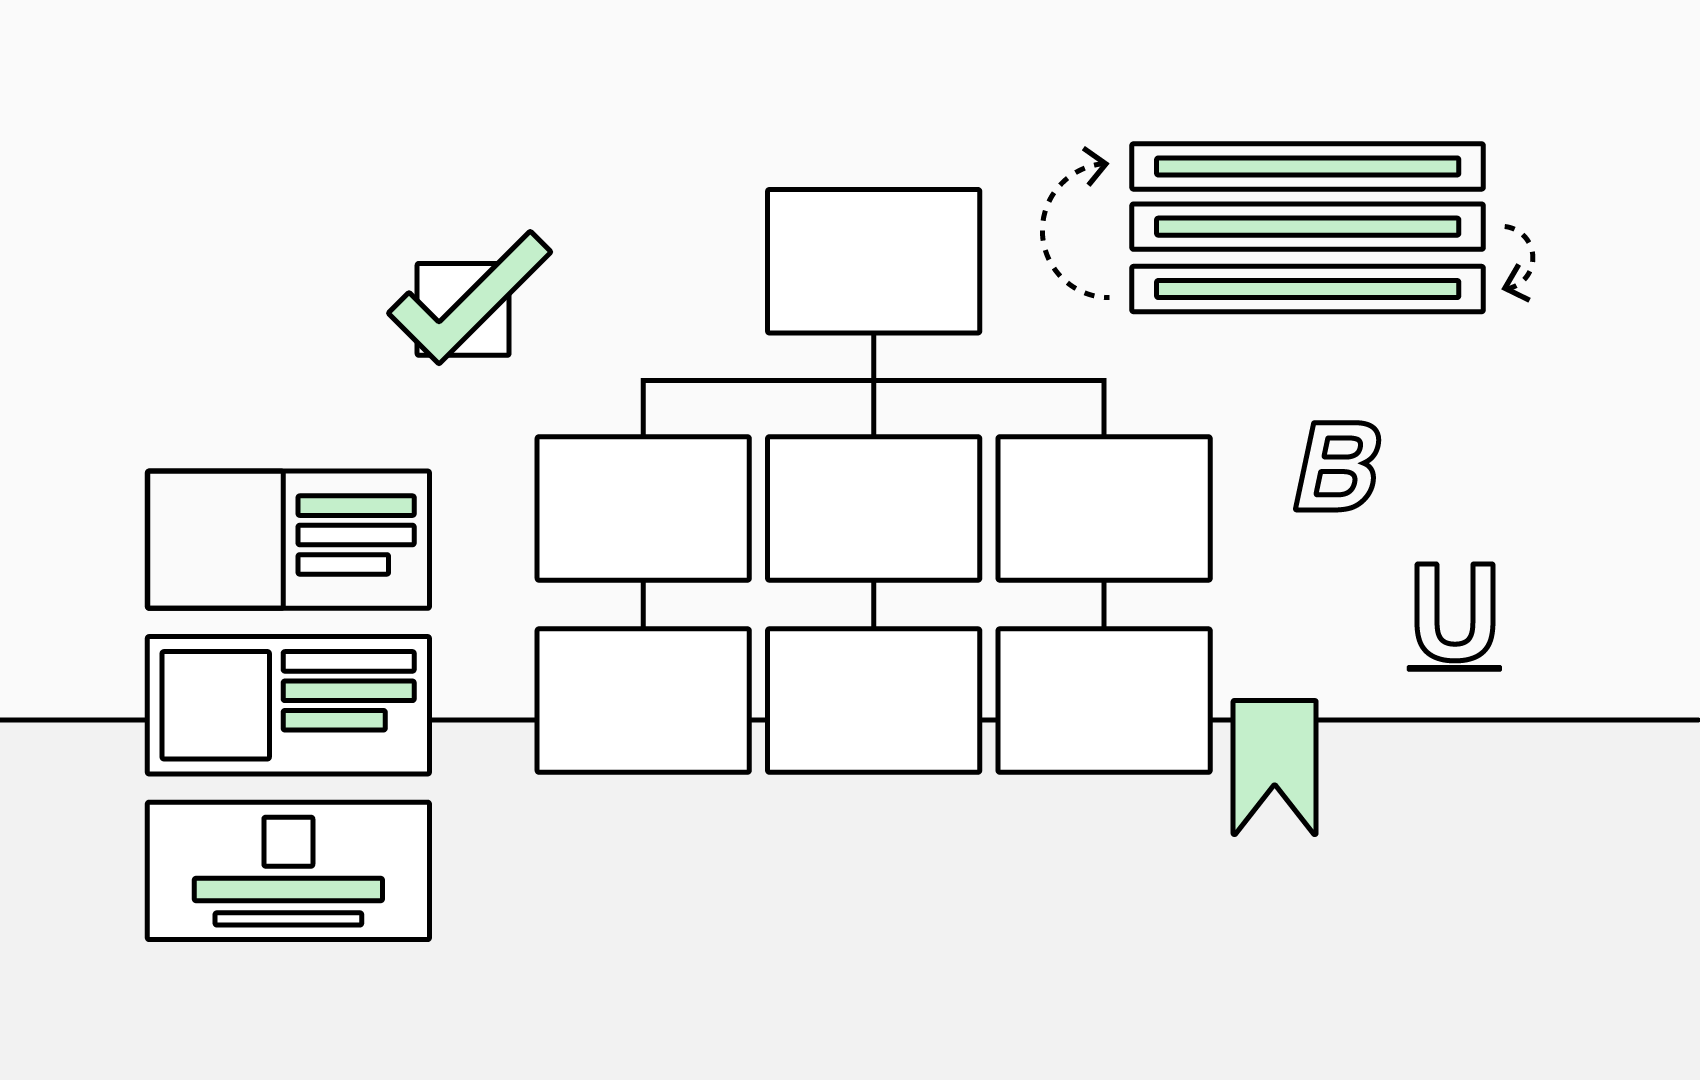
TeamOrgChart offers extensive options for customizing chart boxes, enabling you to highlight the information that matters most to your organization. From the Choose Box Content settings page, you can define which fields appear inside each box. On the Change Styling page, you can adjust layout, color, and size, as well as set styles for vacant or temporary positions.
Once you’ve found a design that works, you can save it as a template and apply it consistently across your charts. This ensures a consistent, professional appearance while making it easy to surface the key details you and your teams rely on.
3. Bookmarks
In large organizations, it’s common to return to the same areas of your chart again and again. Bookmarks let you quickly navigate to frequently visited people or teams without scrolling or searching.
Adding a bookmark is simple: enter edit mode, open the context menu for the individual you’d like to bookmark, and select Bookmark Here. The bookmark will then appear in your bookmarks bar, making it easy to jump straight to where you need to go.
4. Leadership Teams
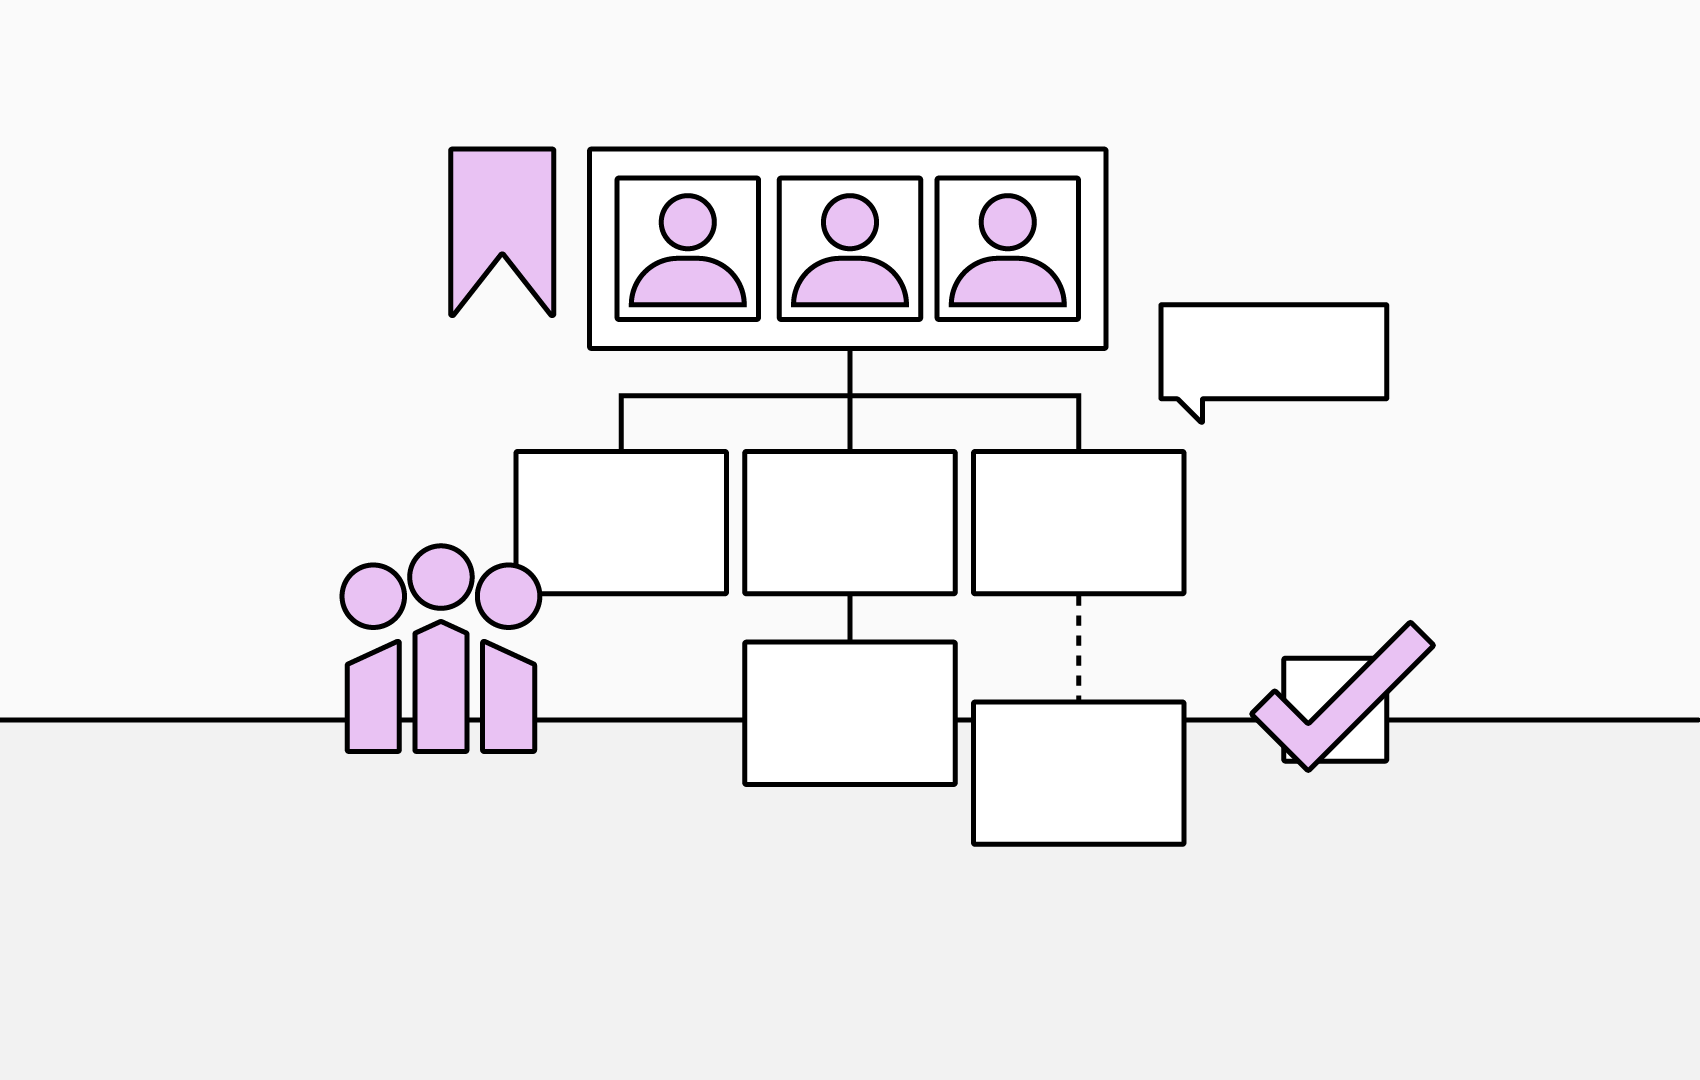
Not every organization has a single leader at the top. With TeamOrgChart, you can represent leadership teams or boards of directors by grouping multiple people together at the top of your chart. This highlights key leadership roles while still providing clarity on the structure below them.
If you need these leaders to appear in more than one place in the chart, for example, in both a board view and a departmental view, you can simply add them as an additional role. This flexibility makes your chart both accurate and adaptable.
5. Annotations
Annotations are a valuable tool for planning and collaboration between chart administrators. You can leave comments directly on chart boxes that only other administrators can see. These notes are perfect for adding context, making requests, or posing questions about future planning.
To add an annotation, switch to the Annotations tab in an individual’s information box. Other admins can then reply or react to your comment. Reactions, such as a thumbs up, are a quick and clutter-free way to acknowledge agreement or feedback without adding lengthy responses.
Final Tips
To get the most out of TeamOrgChart, take advantage of the customization options available. Streamline your charts by choosing box styles that make key information visible at a glance, and strategically place bookmarks to keep important areas just one click away.
If your organization is large, you may also want to set a bookmark as your chart’s default start position from the Manage Bookmarkssettings page. This can be different for each user and ensures that you always land in the most relevant part of the chart right from the start.