Understanding Your Organization with Chart Statistics
Understanding your organization’s structure should be simple. With TeamOrgChart's Chart Statistics feature, you can instantly view key data about your organization, teams and individuals right from your org chart.
This gives you a dynamic, data-driven snapshot of your organization, helping leaders make faster, smarter decisions.
What Are Chart Statistics?
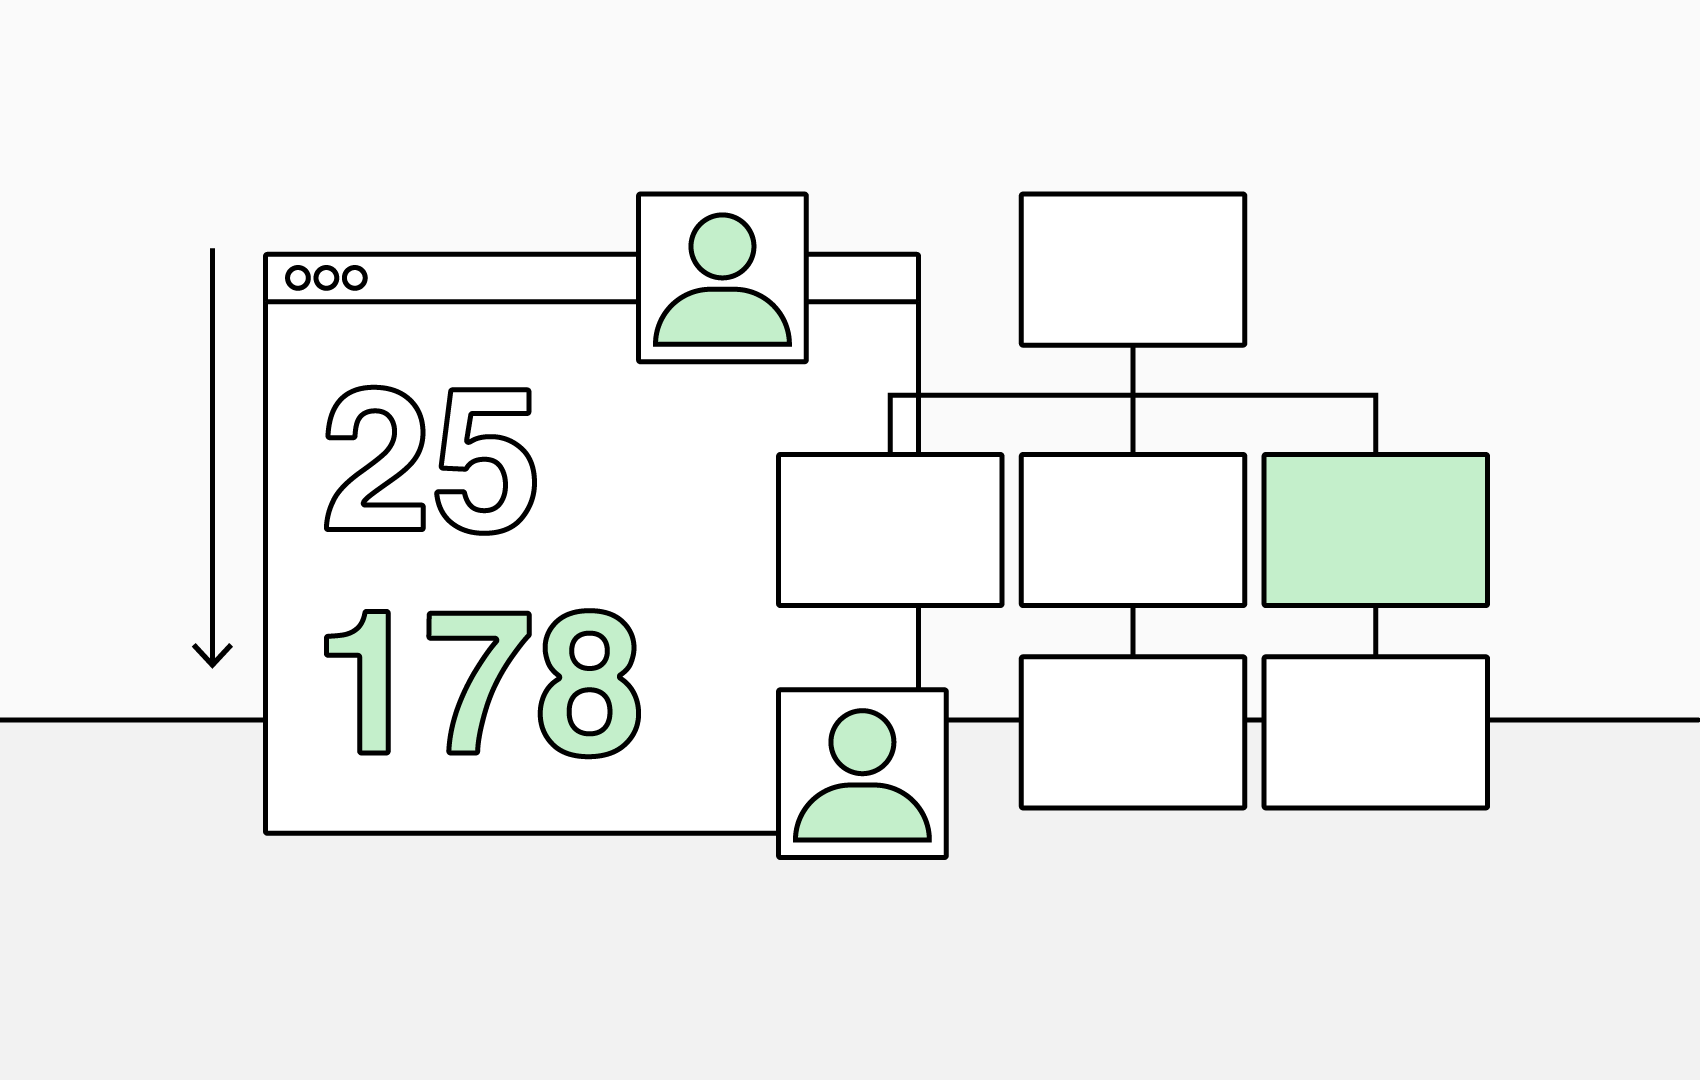
The Chart Statistics box displays key insights about your organizational structure as you explore it. When you select an individual box—or move through your chart—the statistics automatically update to reflect that person or team.
You’ll see:
- Direct reports: Number of people reporting directly to the selected individual.
- Indirect reports: Total number of people reporting to this individual at any level (including direct reports)
- Vacant positions: Number of open roles.
- Current level: Where this person sits in the organization's hierarchy.
- Levels below: How many chart levels the reporting structure extends.
These insights make it easier to identify team strengths, spot gaps, and ensure your organizational design stays aligned with your business goals.
How to Enable Chart Statistics
Setup Steps
- Navigate to Choose Box Content settings.
- Scroll to Assign Additional Data Sources.
- From the Available Sources dropdown, select Chart KPI.
- Set a display name (for example, Chart Stats). You can make the stats visible to administrators only, if preferred.
- Define where the information appears, choose from:
- Chart Only: Displayed directly on the chart.
- Info Only: Shown within the information pop-up.
- Both: For maximum visibility.
Finally, click Save — and your chart statistics are ready to go!