5 Common Org Chart Problems and How TeamOrgChart Solves Them
Organizational charts are essential for helping employees understand roles, reporting relationships, and how teams fit together. However, many businesses struggle to maintain org charts that are accurate, easy to use, and insightful.
We’ll explore five of the most common problems businesses face with their org charts—and how TeamOrgChart solves them.
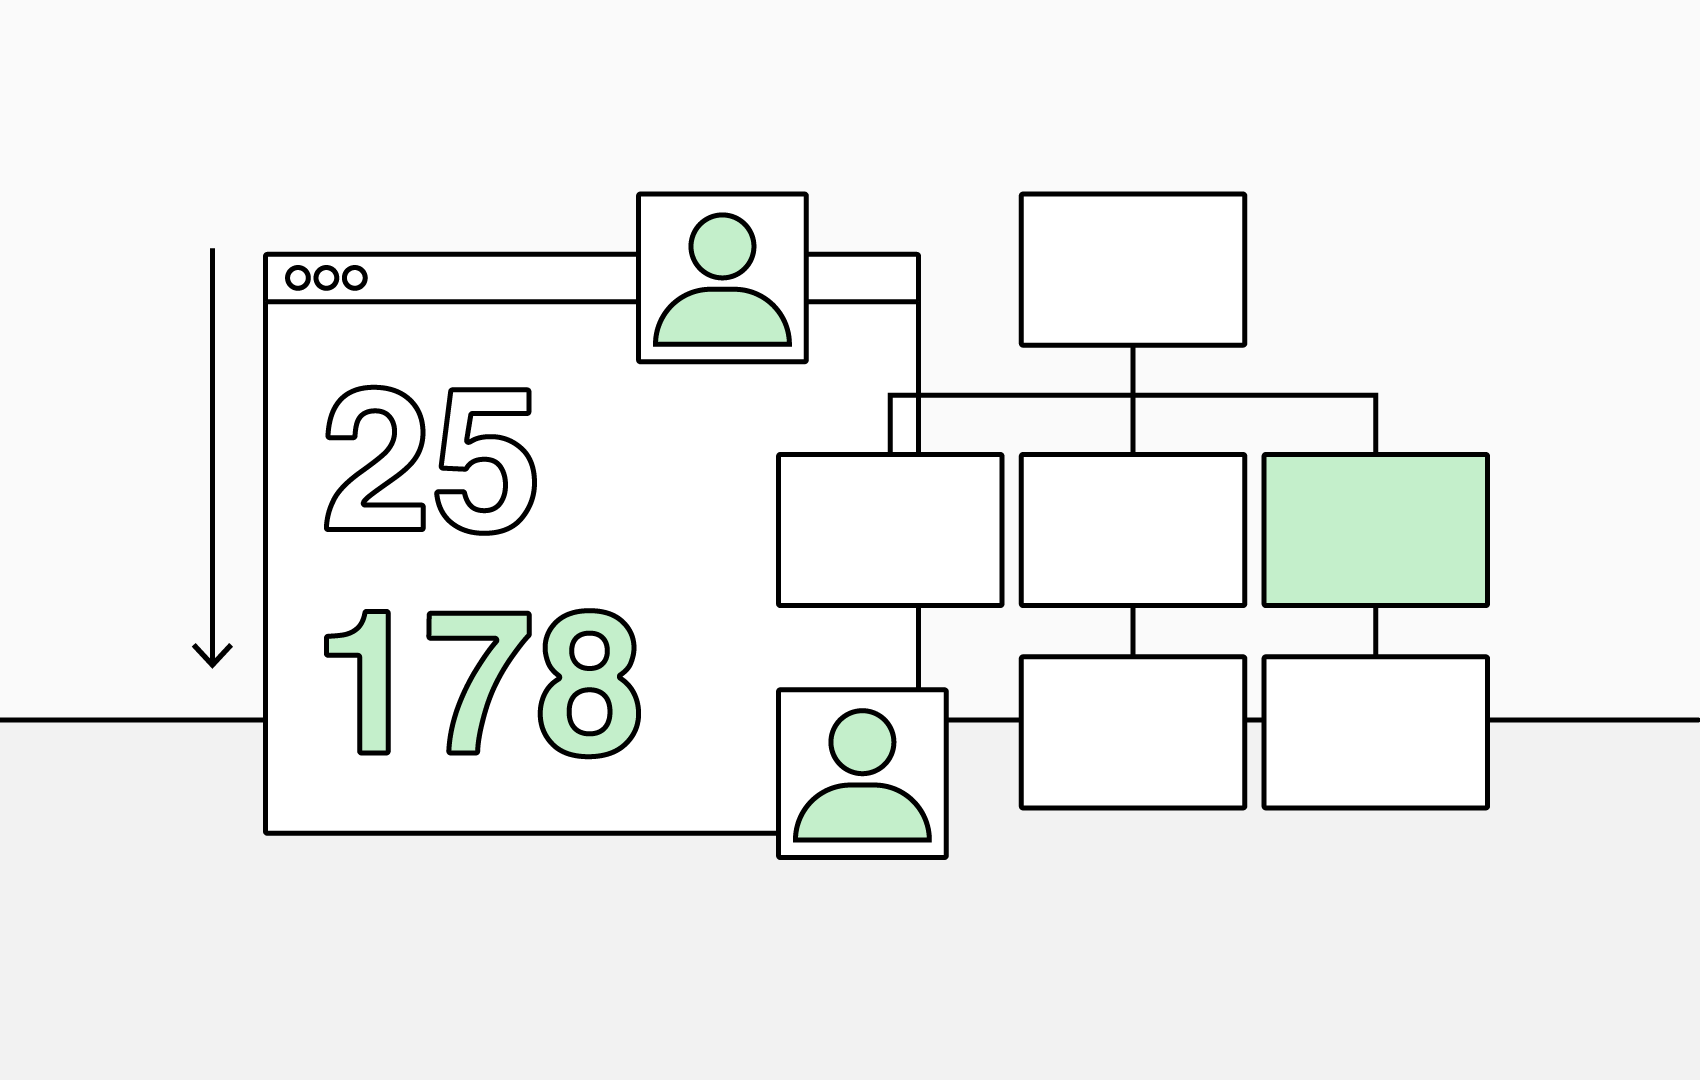
1. Outdated Information
One of the biggest frustrations with org charts is how quickly they become outdated. As soon as someone changes roles, leaves, or takes on additional responsibilities, the chart is no longer accurate.
Problem:
Manual updates lead to inconsistent and unreliable charts, creating confusion about reporting lines and contact points.
How TeamOrgChart Solves It:
TeamOrgChart connects directly to your data sources—like Microsoft Entra ID, SharePoint Lists, or an Excel spreadsheet stored on OneDrive—so charts automatically stay in sync. When an employee’s details change, your chart updates automatically.
2. Limited Accessibility
Traditional org charts often live in static PDFs or PowerPoint slides that only a few people can access and offer little in the way of collaboration.
Problem:
Employees struggle to find the most current version or can’t easily navigate, edit, or share charts.
How TeamOrgChart Solves It:
TeamOrgChart can be accessed on the web and integrates seamlessly into your Microsoft 365 workflow. Charts can be pinned in Microsoft Teams, embedded in SharePoint, or included in internal portals, so employees always have the latest view available.
Role-based access ensures that sensitive information is visible only to authorized users.
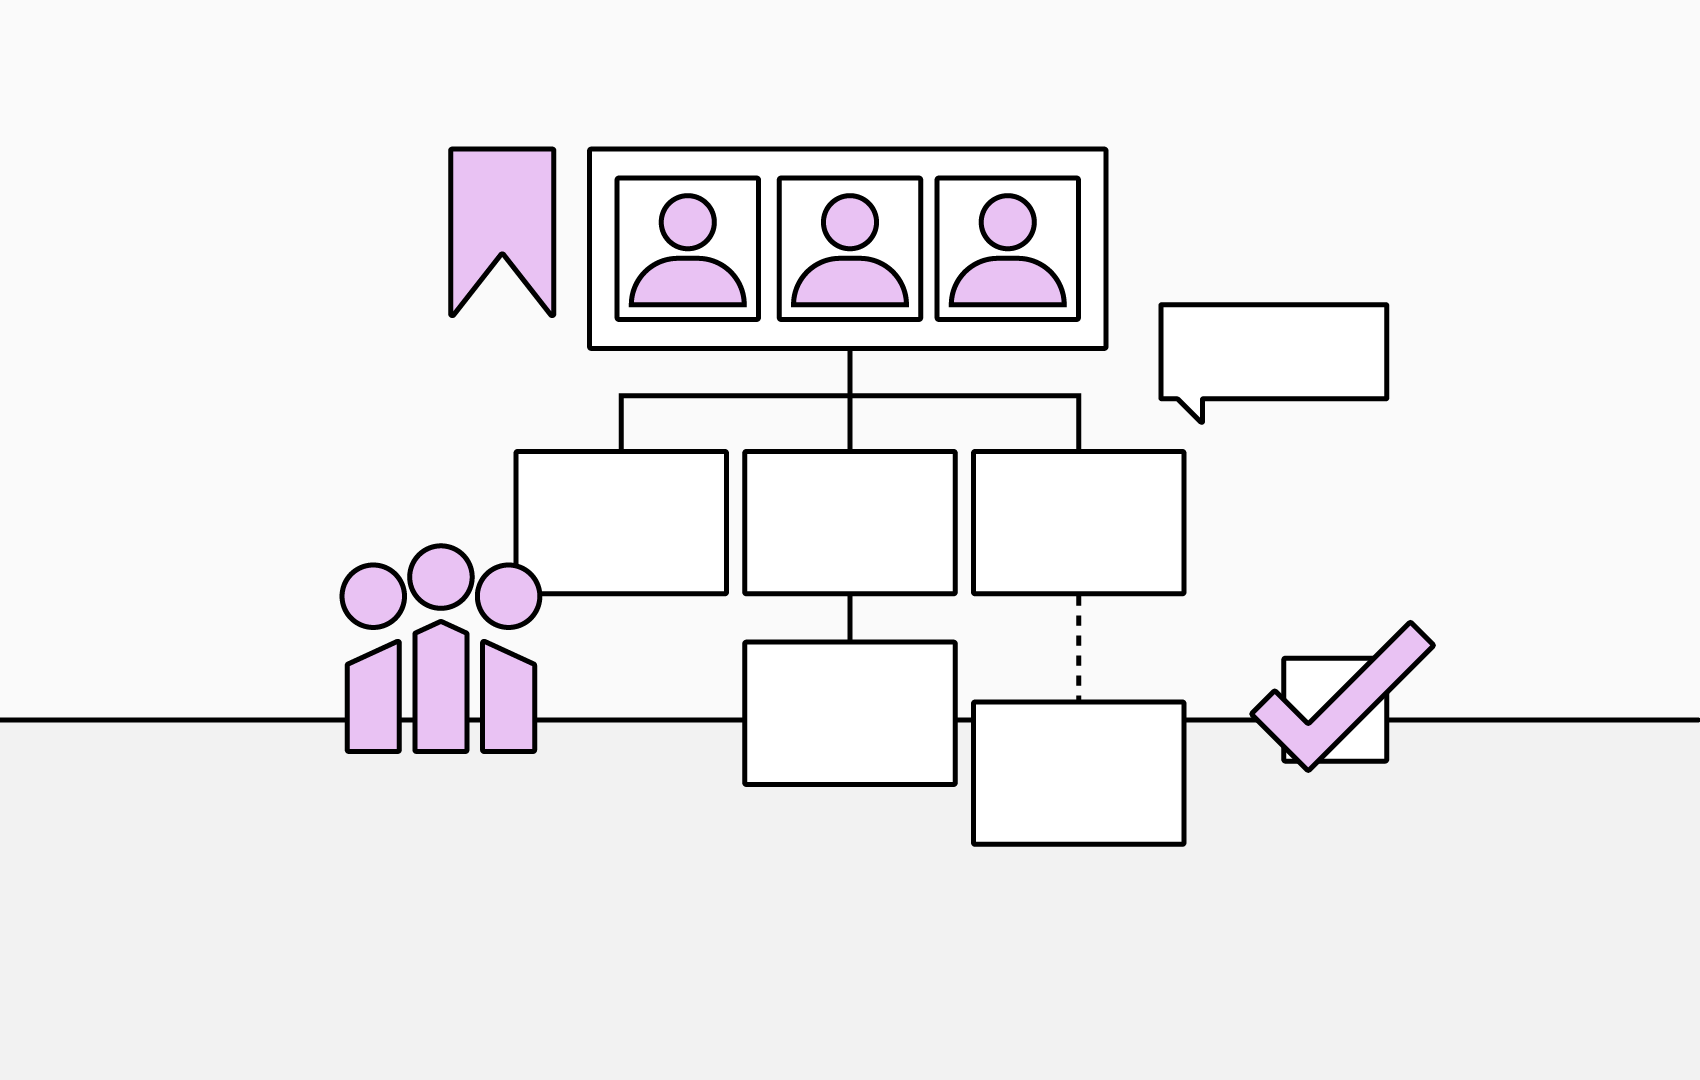
3. Complex Structures and Large Teams
As organizations grow—especially with remote and hybrid work—org charts can become overwhelming, sprawling diagrams that are difficult to navigate or interpret.
Problem:
Large organizations with several teams struggle to show reporting lines, employees with multiple roles, or global divisions.
How TeamOrgChart Solves It:
TeamOrgChart offers smart navigation features such as employee search, bookmarks, and easy hiding or showing of hierarchical layers. You can explore specific teams or individuals without losing sight of the bigger picture, even in complex global organizations. Conditional rules also enable you to streamline your chart and show only the people you need.
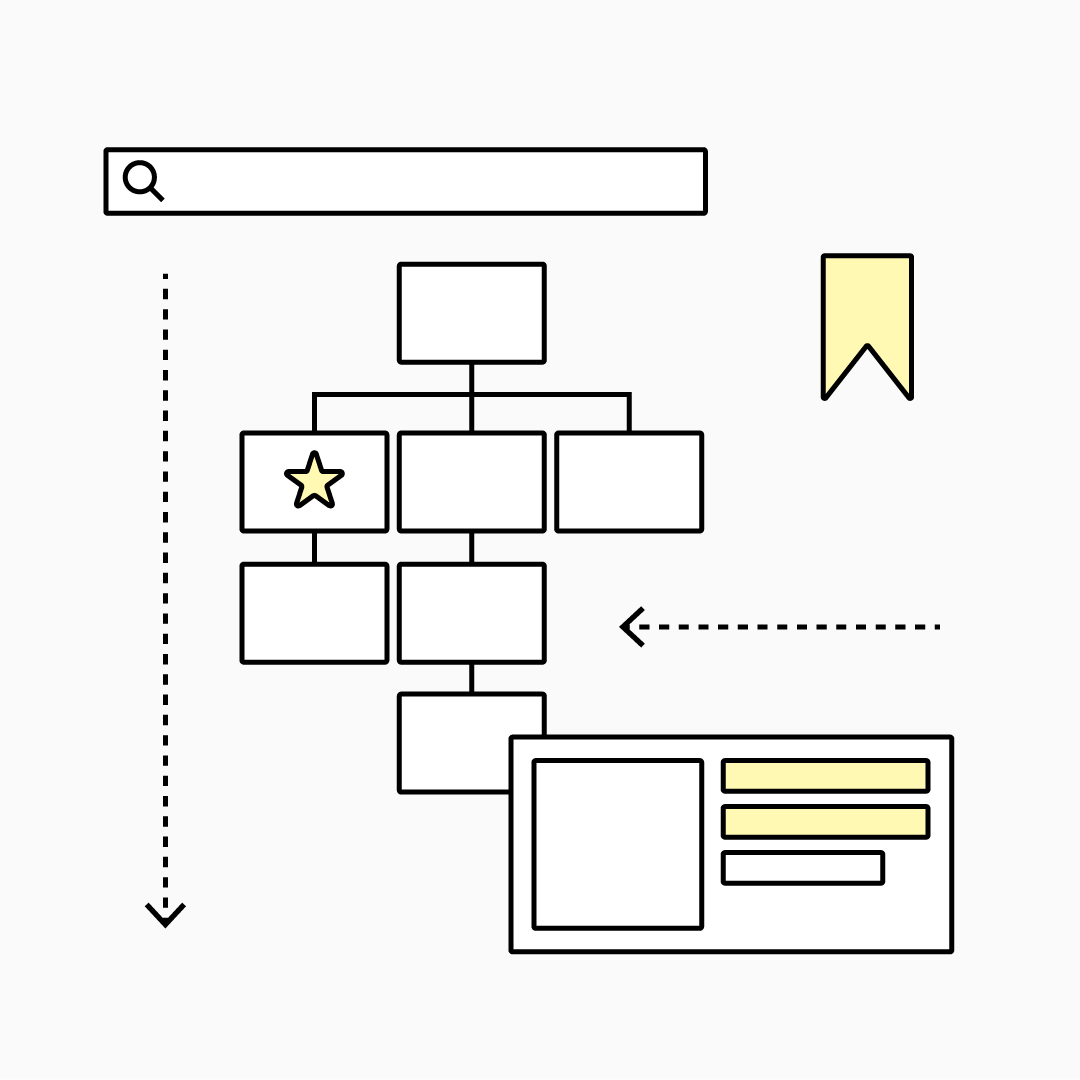
How to Quickly Navigate Your Org Chart
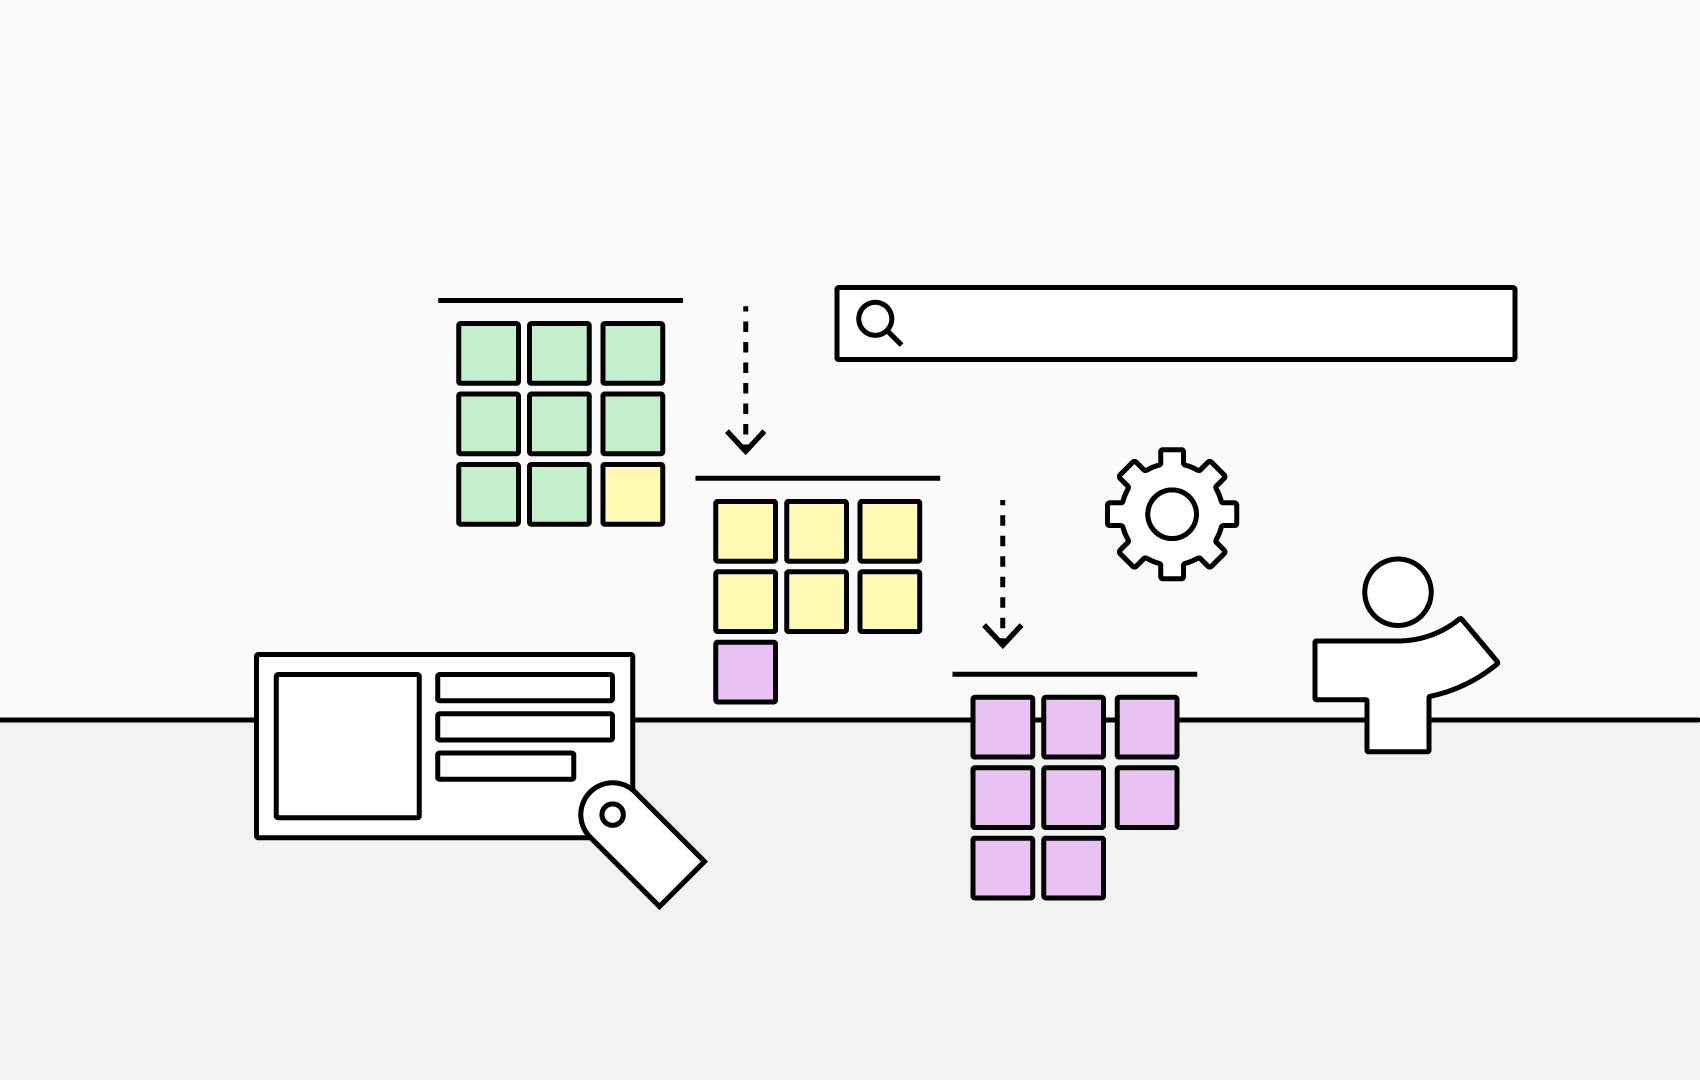
4. Lack of Customization and Context
Static charts often show only names and job titles but miss important context such as departments, projects, or temporary roles.
Problem:
Without customization, it’s hard to get a well-rounded view of your organization, identify who’s in an acting position, or see where vacancies exist.
How TeamOrgChart Solves It:
With conditional formatting, customizable fields, additional information, and filters, you can highlight key details like vacancies, contractors, or temporary appointments. Charts can be styled to match your brand and display the data that matters most to your organization, reinforcing brand consistency internally.
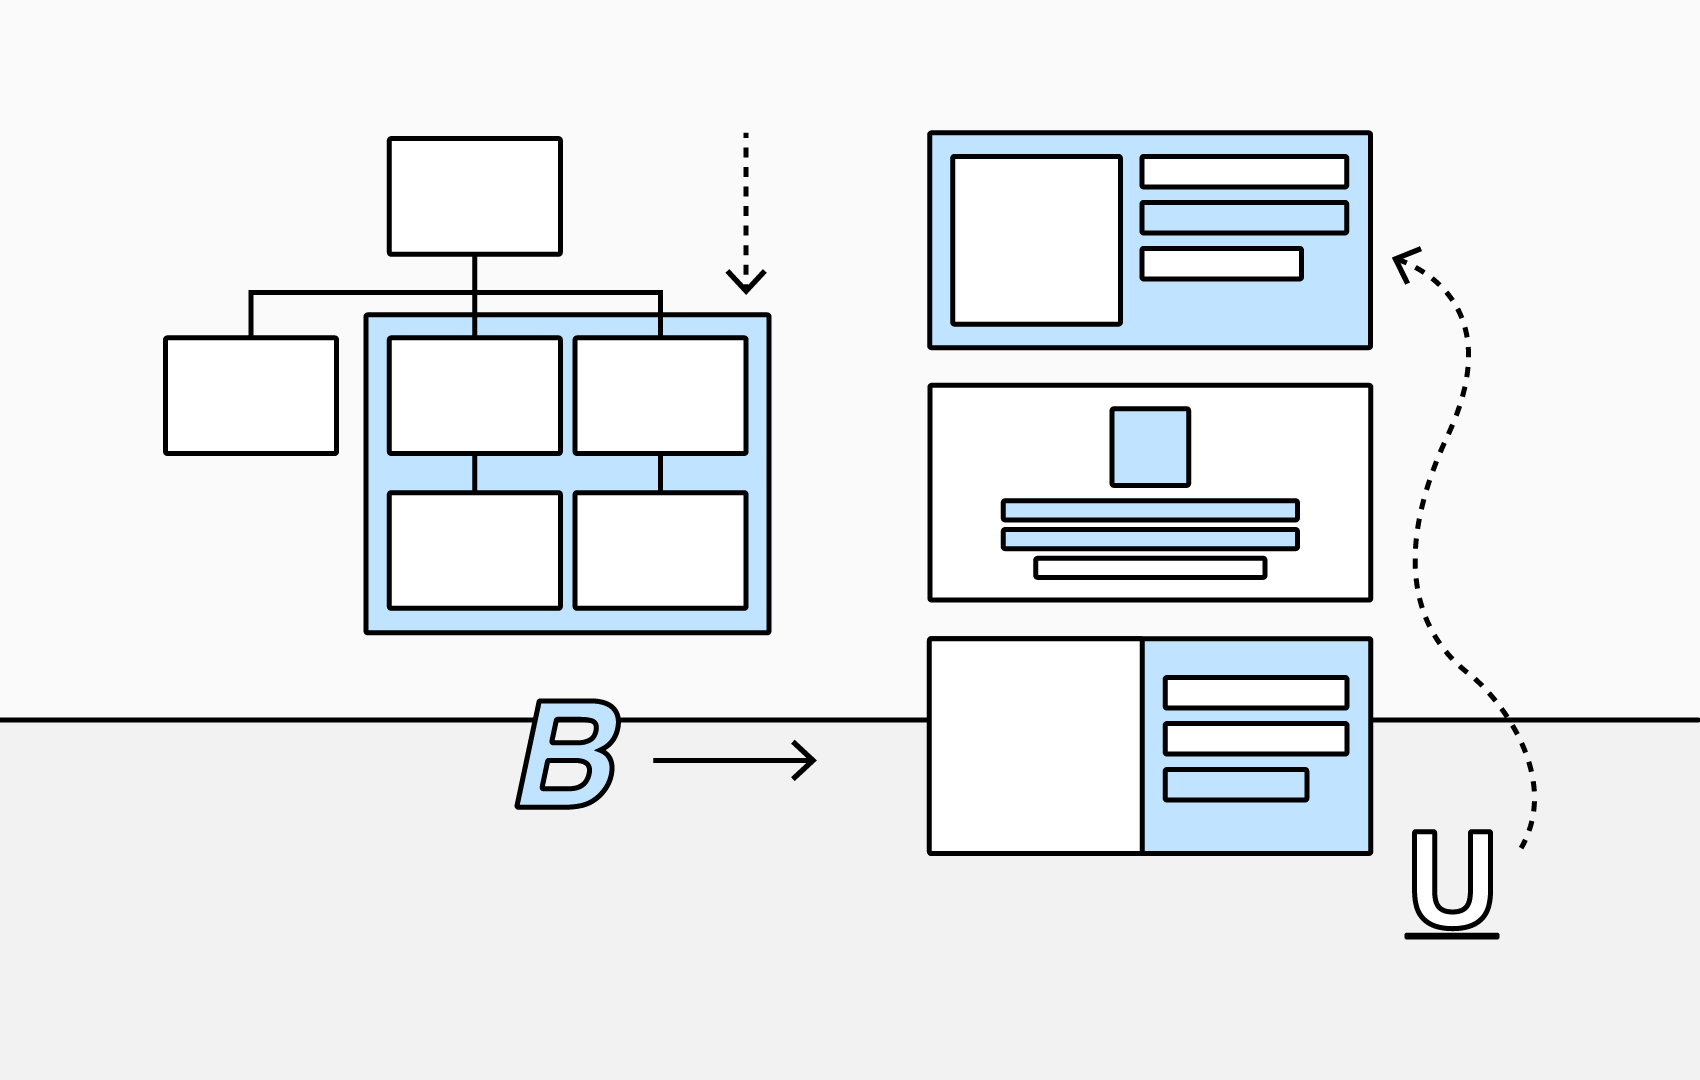
5. Difficulty Planning for the Future
Planning reorganizations or “what-if” scenarios is challenging with static charts—you can’t easily model changes without affecting live data.
Problem:
HR and leadership teams often rely on spreadsheets or external diagrams, which are disconnected from real employee data.
How TeamOrgChart Solves It:
TeamOrgChart includes scenario planning tools that let you model organizational changes safely. You can simulate restructures, new teams, or reporting changes and share them privately for review before publishing.
Org Charts Made Simple
TeamOrgChart brings visual structure, clarity, and automation to your organization. By solving the common problems of outdated data, limited visibility, and complex management, it helps teams stay connected and informed.
- Always Up to Date: Automatically syncs with data sources.
- Accessible Anywhere: Integrated into Teams, SharePoint, and the web.
- Powerful Customization: Tailor layouts, colors, and data fields to your needs.
- Insightful Planning: Build and review future structures without affecting the live chart.
In a fast-moving workplace, clarity and transparency are essential. With TeamOrgChart, your org chart becomes more than a diagram—it becomes a live, interactive map of your organization.