Getting Started with TeamOrgChart - Part 5: Customization
Customize your chart to refelect your organizational structure, working practices and to highlight key information.
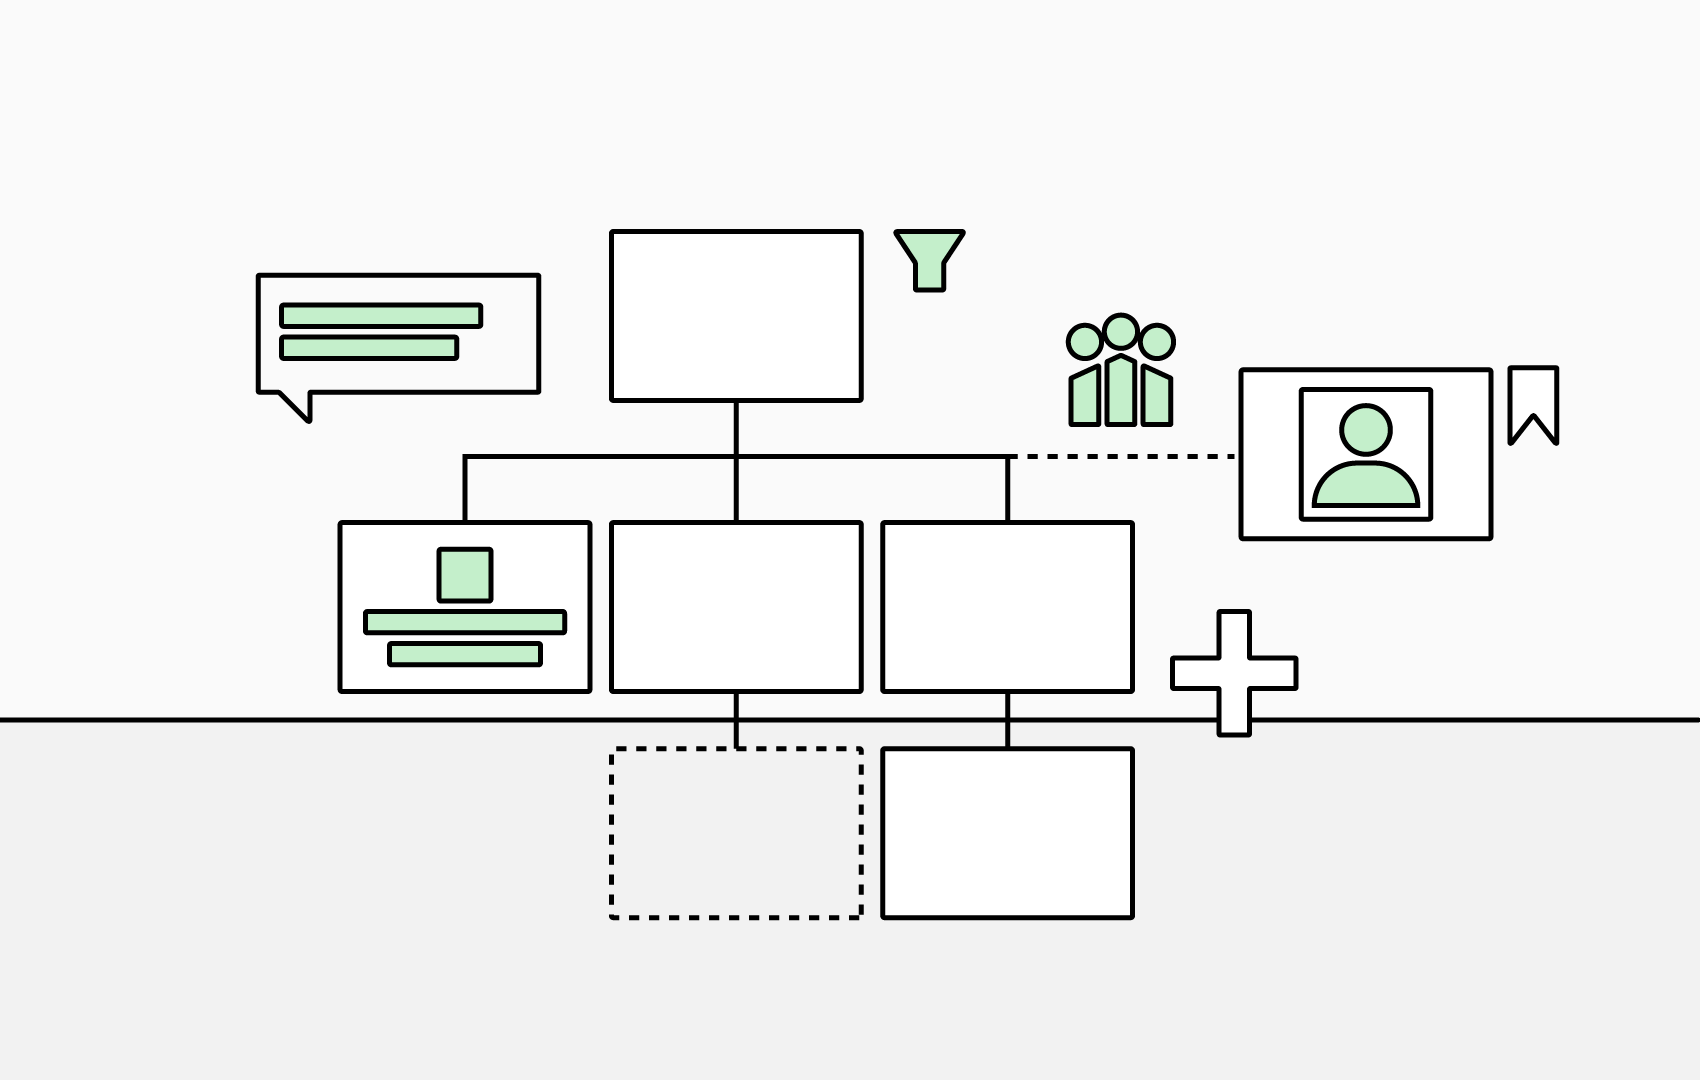
Choose What Information is Displayed in Your Chart
In Your Chart Boxes
Click 'Choose Box Content' in the chart toolbar.
- Add information to your chart boxes by selecting a data column from the 'Select a new column to add' dropdown menu and clicking 'Add New Column'.
- Remove information from your chart boxes by clicking the 'three dot icon' on your chosen data column and clicking 'Delete' on the subsequently displayed options.
- Style the information displayed in your chart boxes. Options include color, size and font family.
- Reorder the information displayed in your chart boxes; simply drag and drop into your required order.
Click 'Save' to apply your changes.
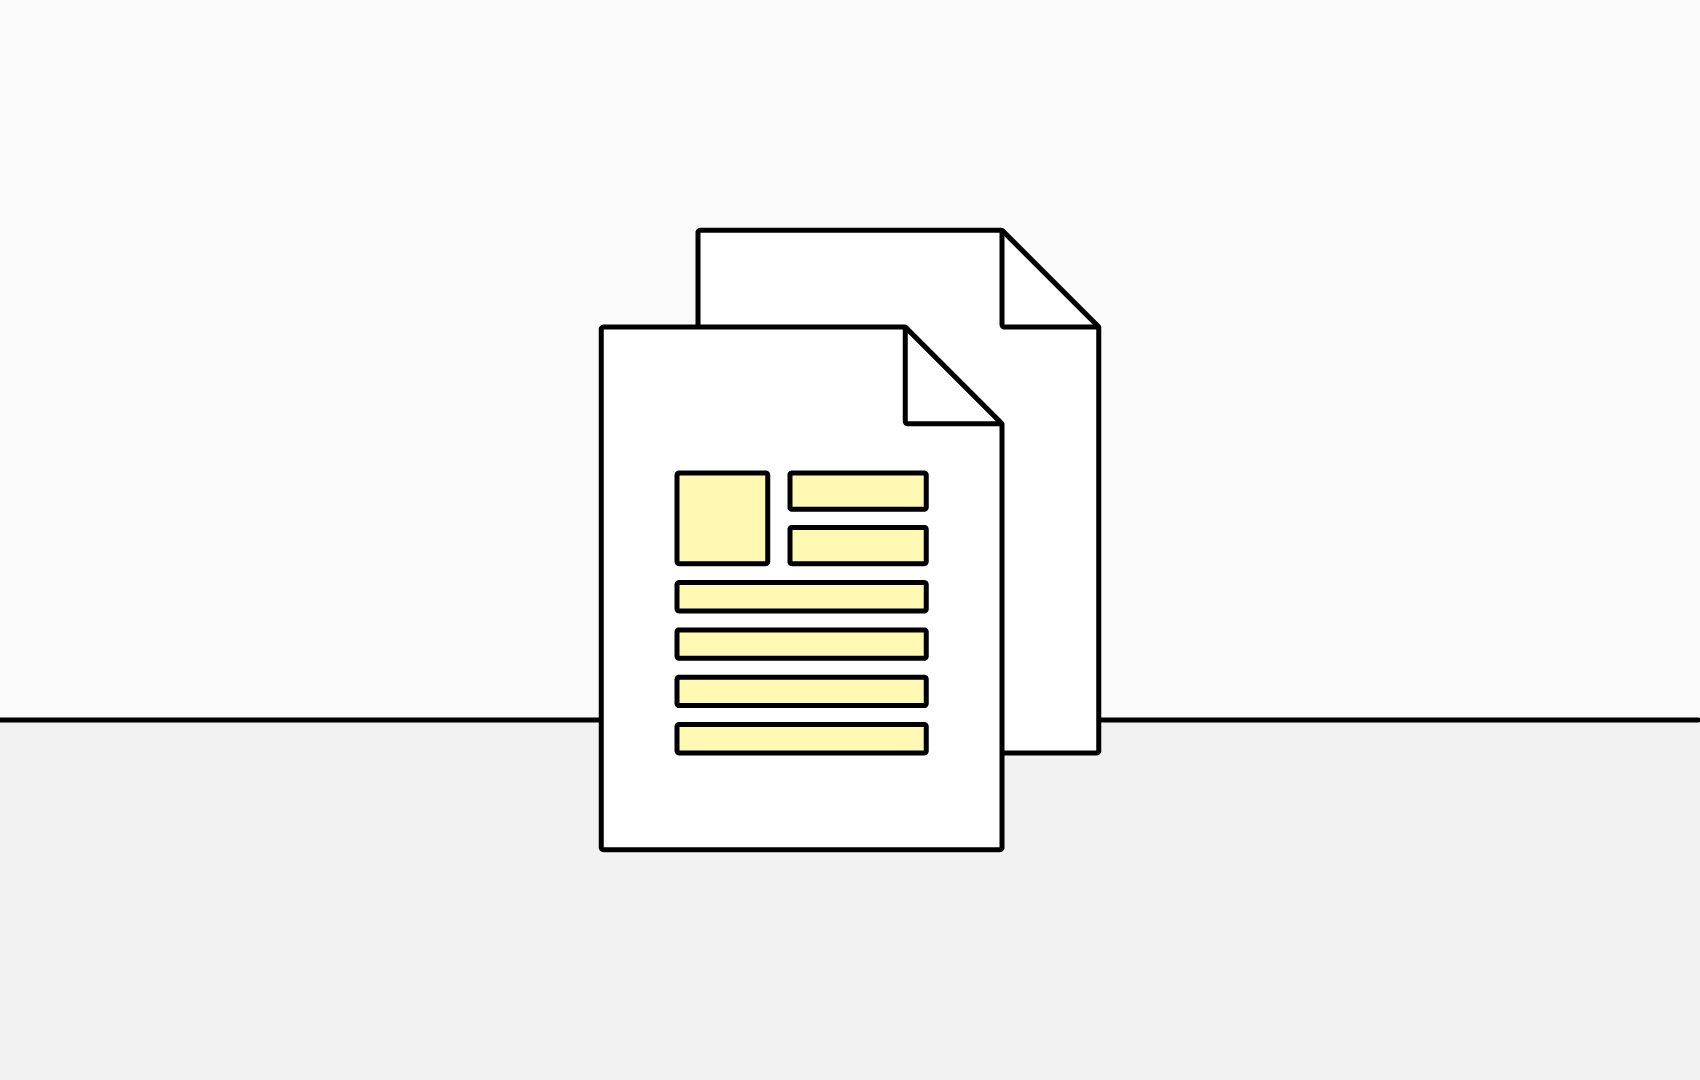
In the Information Window
- Click 'Choose Box Content' in the chart toolbar.
- Scroll down to the 'Choose the Columns for Search, Staff Directory and Information Window' section.
- In the 'Show in Information Window' column, check or uncheck the columns you wish to be displayed.
- Click 'Save' to apply your changes.
Choose Who Appears On Your Chart
You may find that there are people within your chart who you wish to exclude.
This is often the case when using Microsoft Entra ID as a data source, as this will often contain service, administration and test accounts.
To exclude these people, use TeamOrgChart's Conditional Rules.
A rule consists of two parts:
- An Expression — checks if information in each box, or item, in the organizational chart meets a specific requirement. For example, 'JobTitle' equals 'Director' or 'Country' equals 'USA'.
- An Action (or Actions) — what to do if the expression is met. For example, 'Exclude from Chart'.
Create a Conditional Rule
- Click 'Conditional Formatting' in the chart toolbar.
- Click 'Add a New Rule'.
- Add an expression by clicking 'Add an Expression' and defining:
- a column to test, such as 'Job Title'
- an operator, such as 'Contains'
- a value (or multiple values), such as 'Web' and 'Digital'
- Click 'Save'.
- Add one or more Actions to take if the expression is met. To exclude people from your chart, use the 'Exclude from Chart' action; when applied this will remove them from both the chart and search results.
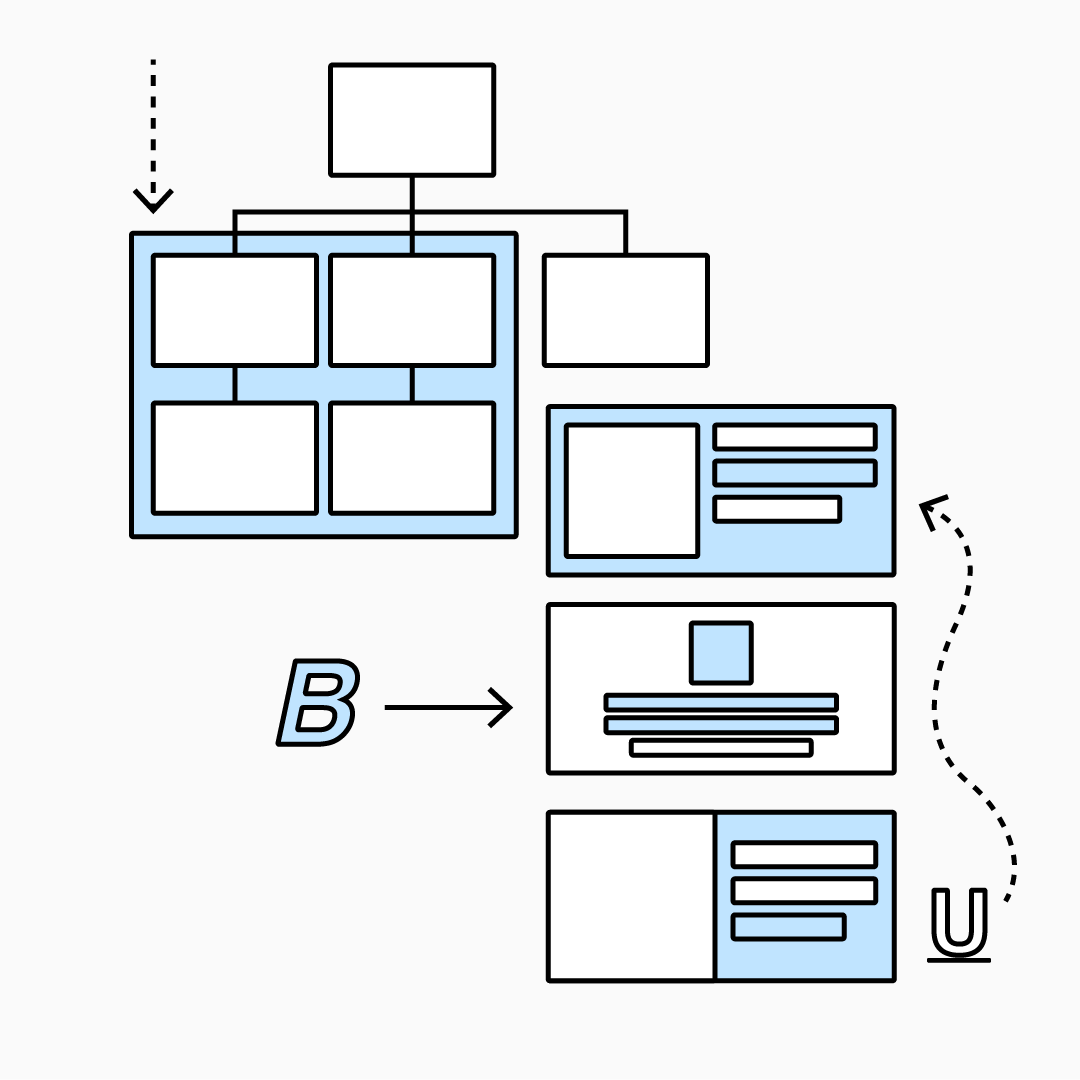
Styling Your Chart
Customize the appearance of your chart boxes, ensuring that your organizational charts are visually aligned with your preferences or corporate branding.
Click 'Change Styling' to access customization options including layout, size, visual style, background and border color.
Remember to click 'Save' to apply your changes.
5 Ways to Style Your Org Chart
Templates
Create a style and layout you want to use again?
Save your customizations as a template to reuse with multiple charts and ensure visual consistancy across all your organizational charts.