Common Pitfall When Creating an Org Chart
Many businesses fall into avoidable traps when creating their org charts. Let’s explore the most common pitfalls and how to avoid them.
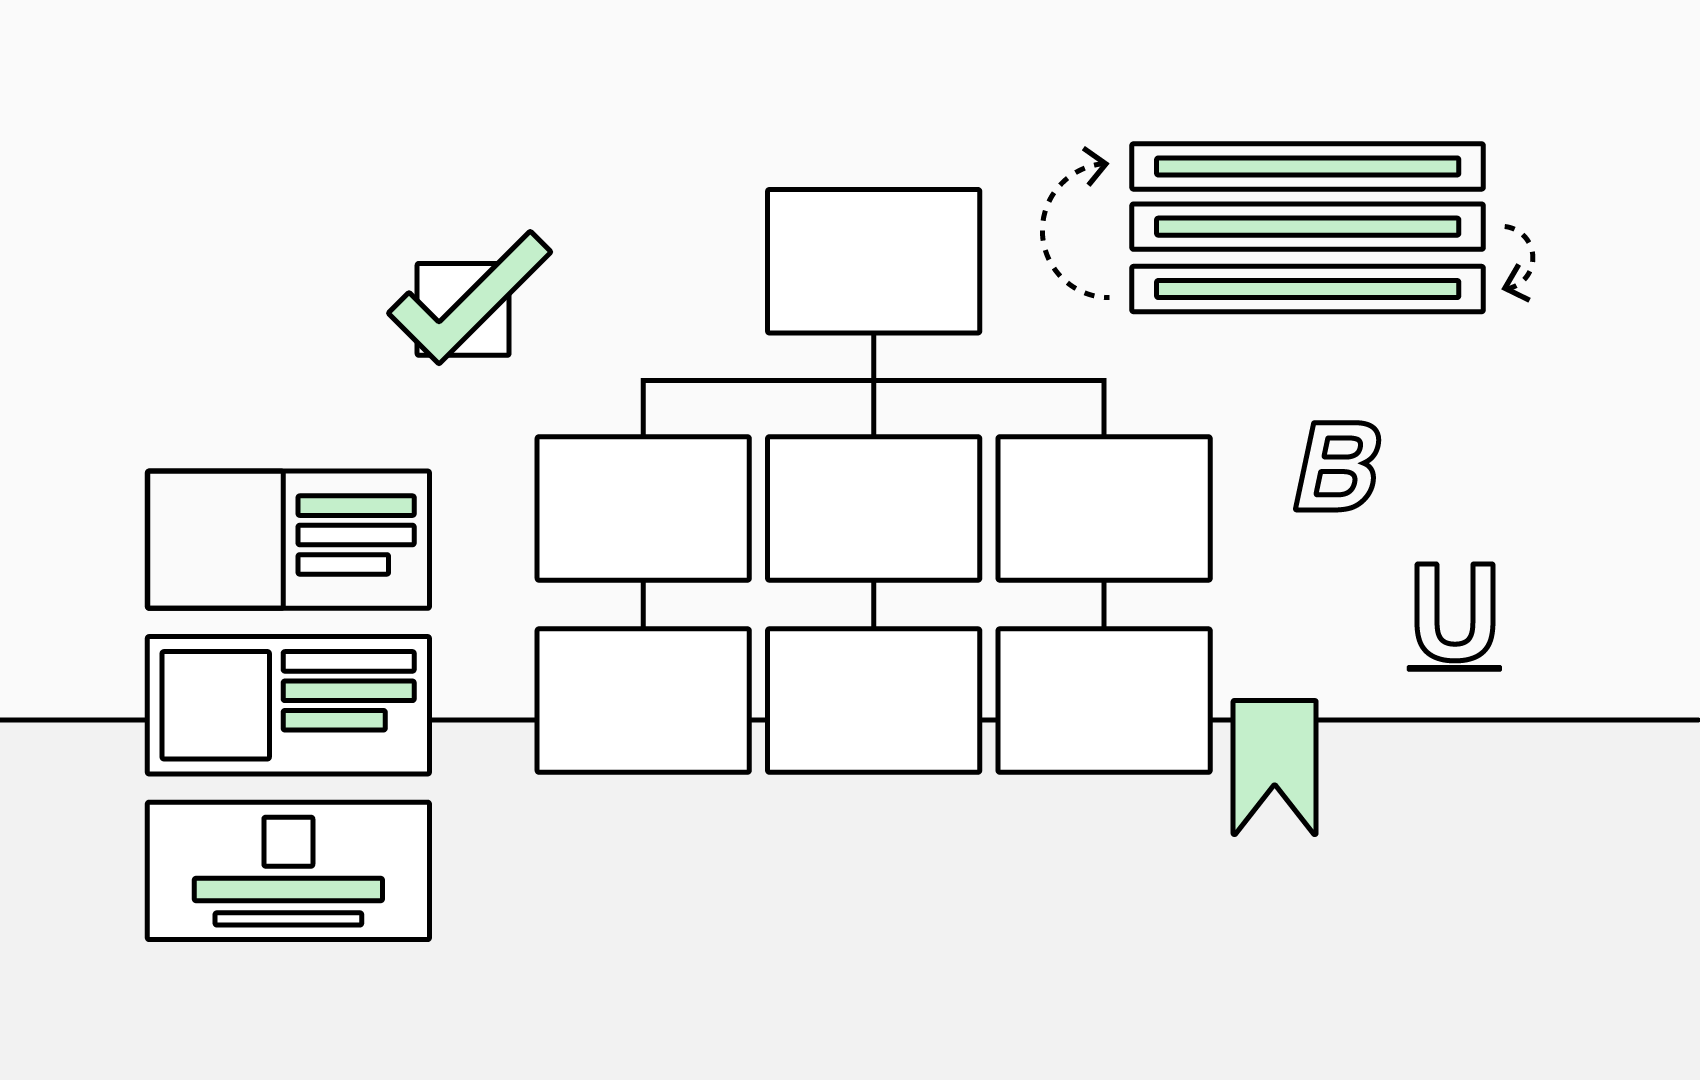
Overcomplicating the Chart
Trying to display every single detail, such as job duties, current project, location, can make charts difficult to read and obscure important information.
The Solution: Keep it simple. Focus on the information you need frequently and quick access to contact details.
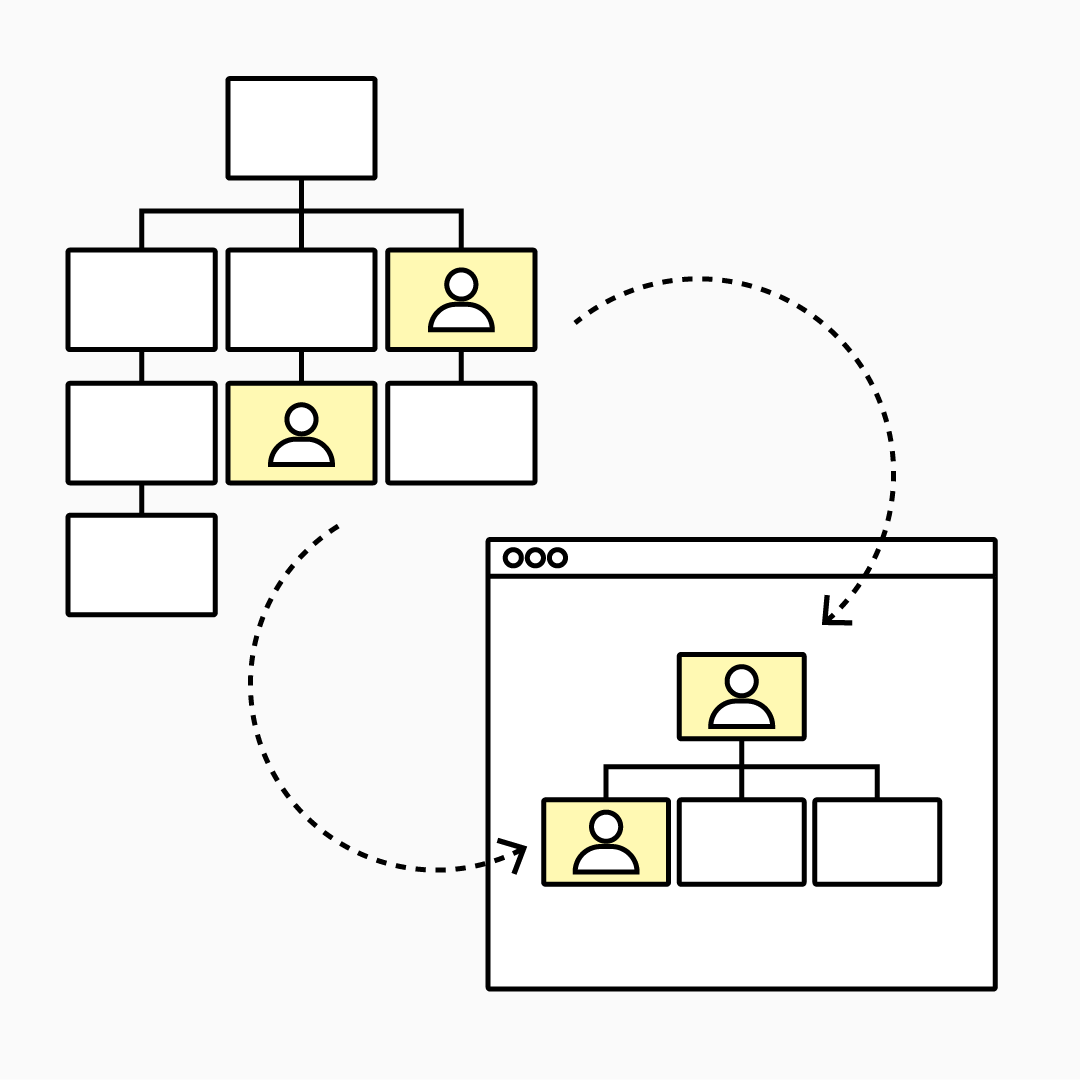
Outdated Information
An org chart is only useful if it’s current. Static charts quickly become obsolete as people leave or roles shift.
The Solution: Use software, such as TeamOrgChart that automatically syncs to your data source (such as Microsoft Entra ID) in real-time.
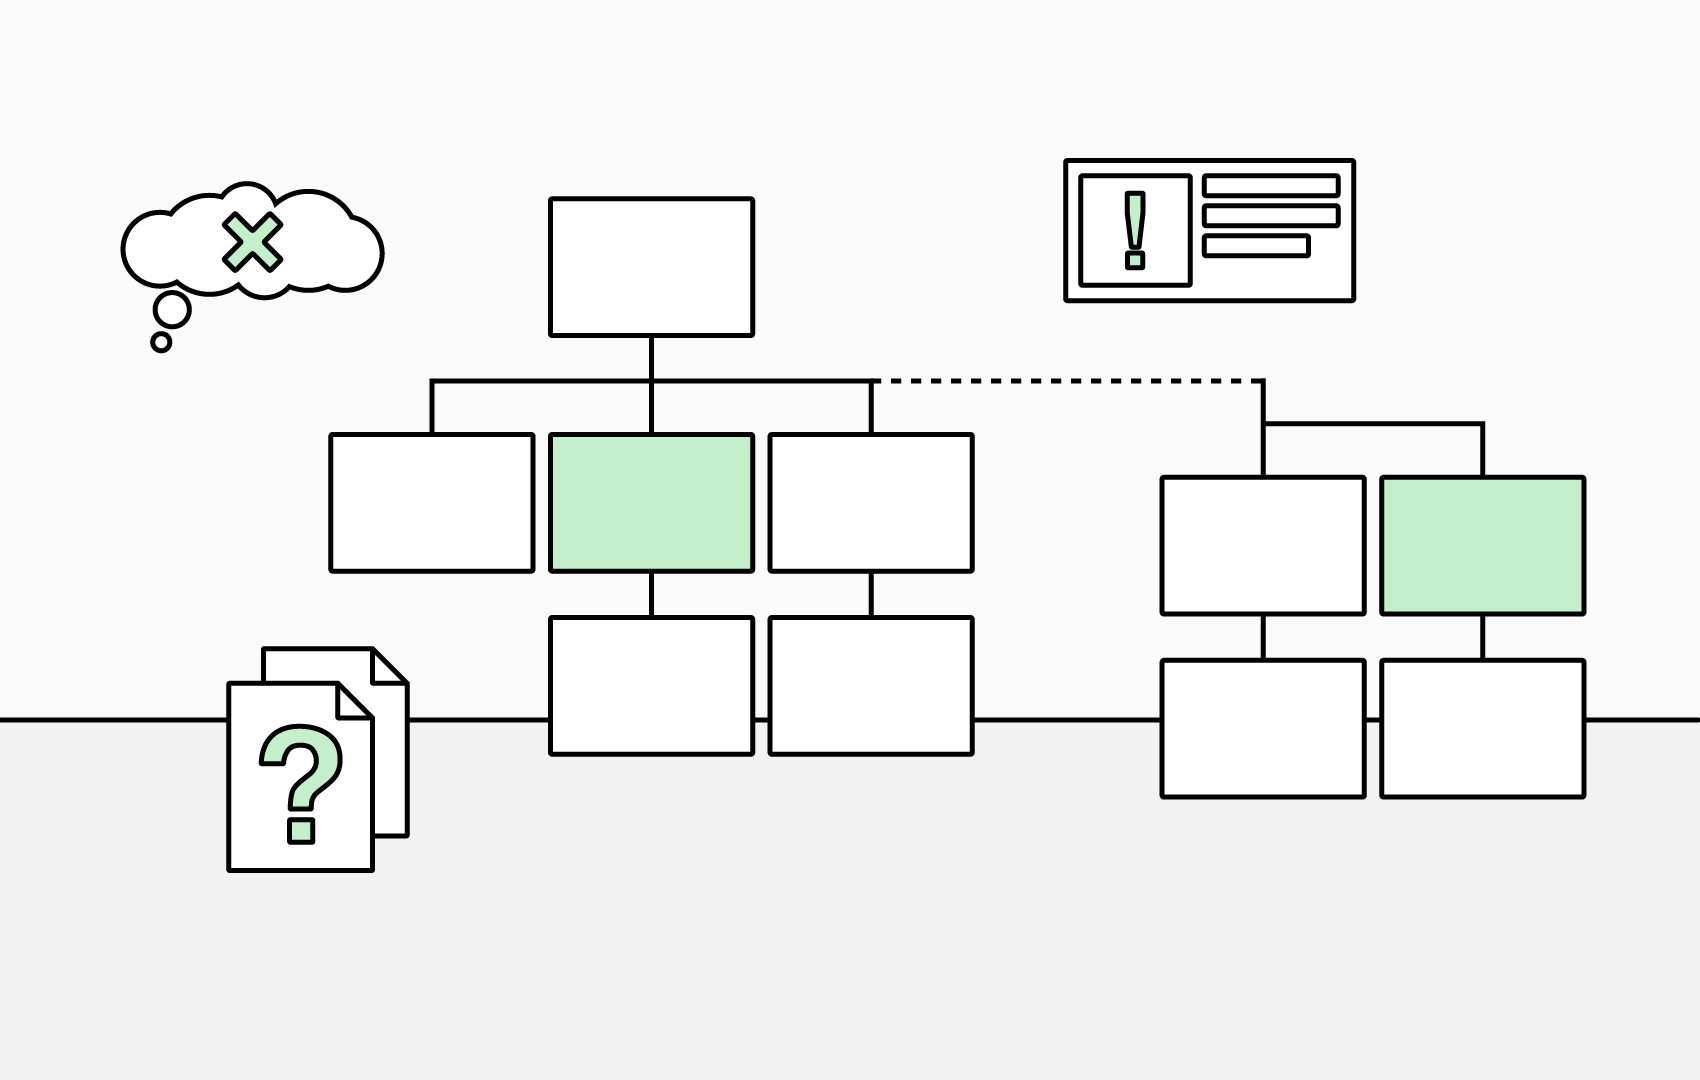
Ignoring Non-Traditional Structures
Companies that use cross-functional teams, such as tiger teams, often leave them out, creating confusion.
The Solution: Highlight dotted-line relationships and project teams in your chart, even if they are temporary.
Building High Performance Tiger Teams
Neglecting Employee Input
Creating org charts without an employee perspective often leads to important dynamics being missed.
The Solution: Gather feedback to ensure accuracy and usability, find out what information matter most to your employees.
Poor Accessibility
Charts stored in PDFs or static documents are hard to access and update meaning you don't get the full benefits.
The Solution: Choose org chart software that integrated with your existing workflow, enabling you to easily view and edit your org chart from where you already work (such as Microsoft Teams and SharePoint).
Final Thoughts
Avoiding these pitfalls ensures your org chart becomes an important point of reference to assist onboarding, collaboration and planning for the future. The right software makes it simple to maintain clarity and keep everyone on the same page.